Allure Testops is the full-stack commercial testing platform built on the bedrock of Allure Report - an open-source test reporting tool. Report is widely used worldwide; it allows people to read test results easily without looking into complicated logs that are only legible to technically savvy people. Allure Testops further develops this approach to make test results even more accessible.
Today, we’ll go through all the steps needed to set up an Allure Testops instance to work: Integrate with a CI/CD system. Run our tests several times. Get into launch analytics, results analysis, and test case generation.
Prepare your CI
First of all, we need to prepare the CI/CD side. After that, let’s create a project on the Allure Testops side and link the project with the CI system.
Plugin installation (Jenkins, TeamCity, Bamboo)
One option is to install an Allure Testops plugin. We have developed Jenkins, TeamCity, and Bamboo plugins.
Usage of allurectl (command line tool) (GitLab, GitHub)
If your CI does not support plugins, you can use allurectl, the command line tool that implements the API of Allure Testops. This tool will help you import test results from the CI system.
Common part
In either case, we will have to provide some information to your CI about Allure Testops.
- The Allure server URL.
- The ID of our Testops project. A project is the highest level in the hierarchy of Allure Testops; this is what the CI system will be hooked up to.
- Finally, an Allure Testops token - a security token generated on the Allure side.
And vice versa, there is some information we will have to provide to Allure Testops about the CI. Specifically, we need to give some tags for a build job: they will provide more information to our job runs or launches on the Allure side.
The GitHub example: secrets
Let's do all these things one by one using GitHub Actions as an example (if you've got questions about that integration, you can also visit the documentation page). First, we create a new project on the Allure Testops side. There it is, fresh and empty:
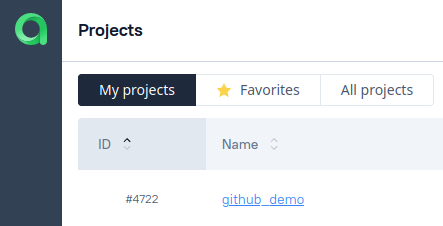
We'll need to provide three things to our CI: the URL of the server, the ID of our project on the server (the number in the screenshot above), and the security token. We'll have to generate that last one in our profile. There is a Create button right below our existing tokens:
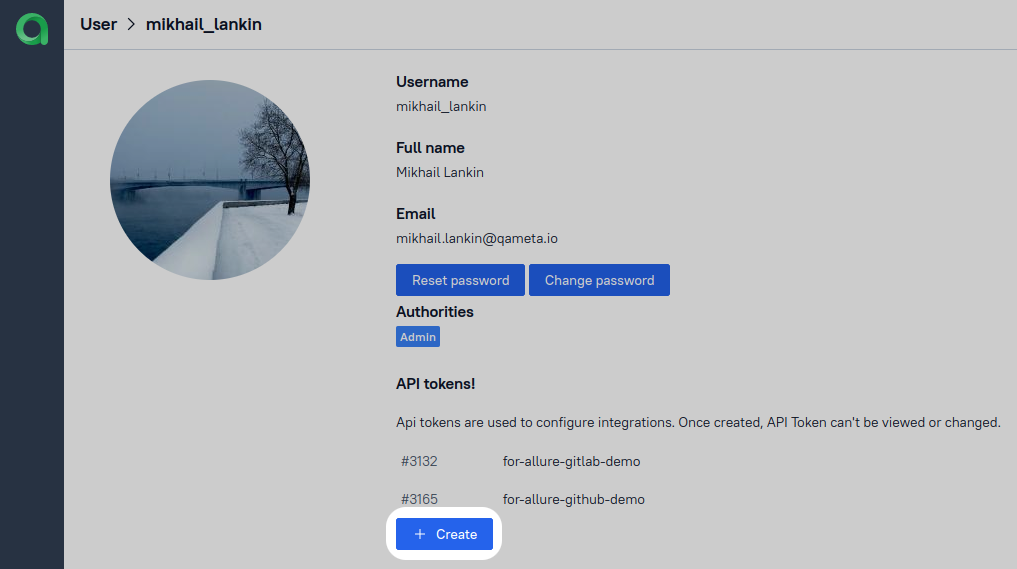
Once we've got the token, we need to copy its value (keep in mind we'll only be able to see it once). Then, we provide it to GitHub along with the server and the project ID.
I won't go into detail on how to upload our code to GitHub - I'm assuming you've already got a repo there. For this demo, we'll be using one with some tests for attachments in Allure. The info we've got to provide to GitHub will be stored as secrets. Here's how we get to them in our repo: Settings > Security > Secrets and variables > Actions. There, we'll need to create three secrets:
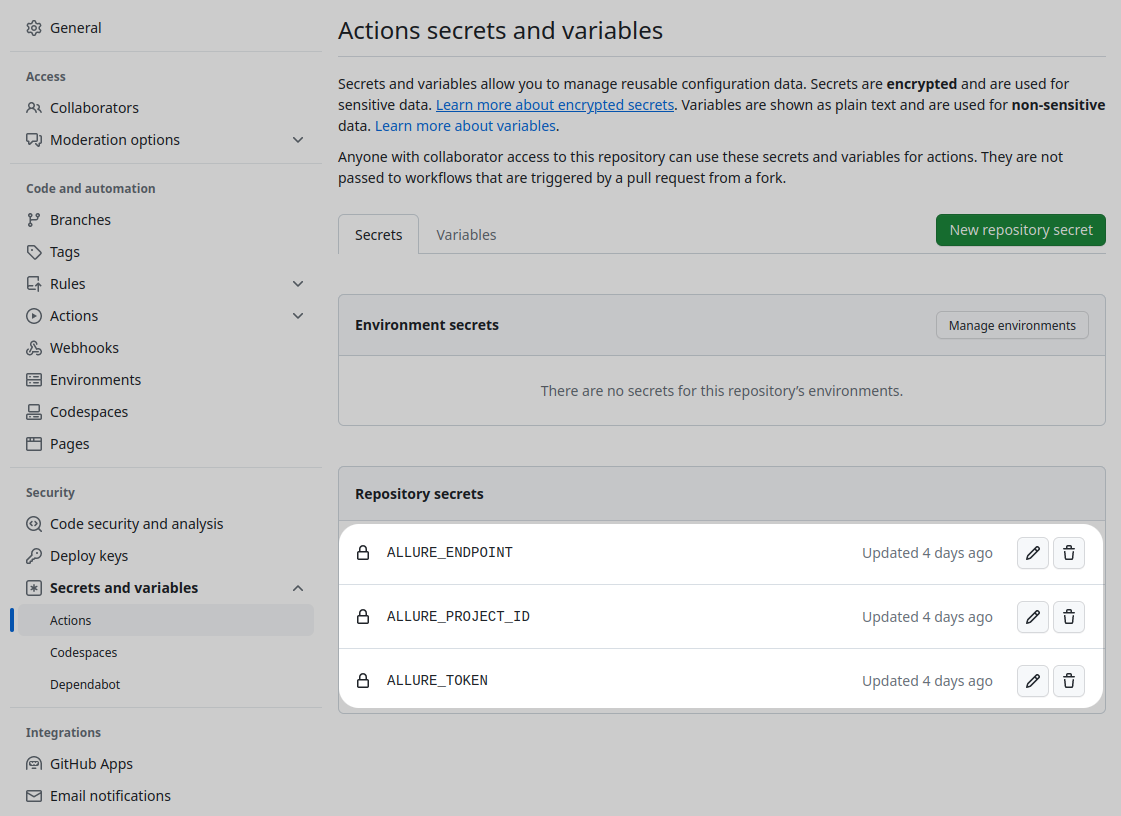
ALLURE_ENDPOINT- that's the URL of Allure Testops;ALLURE_PROJECT_ID- that's the ID of our project (in this case, it's #4722);ALLURE_TOKEN- that's the token we've just generated.
The next step of configuring the CI side is linking the project.
A GitHub workflow
One more thing we'll need to set up on the GitHub side is a workflow. It's a YAML file that resides in our repo, in .github/workflows. Even if you're very experienced, you probably won't be able to write it from scratch, relying solely on the power of your brain and hands: more likely, you'll copy-paste one and fiddle with some fields. This is why we've prepared an action for your workflow to install and configure allurectl. You can also take a look at the workflow used in this demo, but keep in mind that a lot of the stuff there is project-specific. You'll need the variables starting with ALLURE for sure.
In other CI systems, this step has less text and more menus, so it might be somewhat easier (see the Jenkins example, for instance).
Prepare Allure Testops
Now that we're done with the CI side, we've got to take care of some stuff in Testops. First, we must get information about the environment from GitHub to Allure Testops.
Setting up the environment
We do this by linking environment variables to each other. In our project, we go to Settings > Environment and click Create:

The value on the left is the custom variable we want to set up; on the right, we have the values of existing global variables. We want to add Testops's Browser and Host variables to their equivalents from GitHub. So, how do we know what they are called in GitHub? We define them ourselves in the workflow file. In our file, there is a section:
on:
  # push:
  workflow_dispatch:
    inputs:
      TEST_ENDPOINT:
        description: "Endpoint for tests"
        required: true
        default: https://qaq.oka.qu.qu.qu
      TEST_BROWSER:
        description: "Browser used for tests"
        required: true
        default: chrome
On the GitHub side, it allows the user to input stuff as the value endpoint and browser. The variables are called TEST_BROWSER and TEST_ENDPOINT, so we use those names in the screenshot above to link them to Allure Testops variables.
Fetching a GitHub token
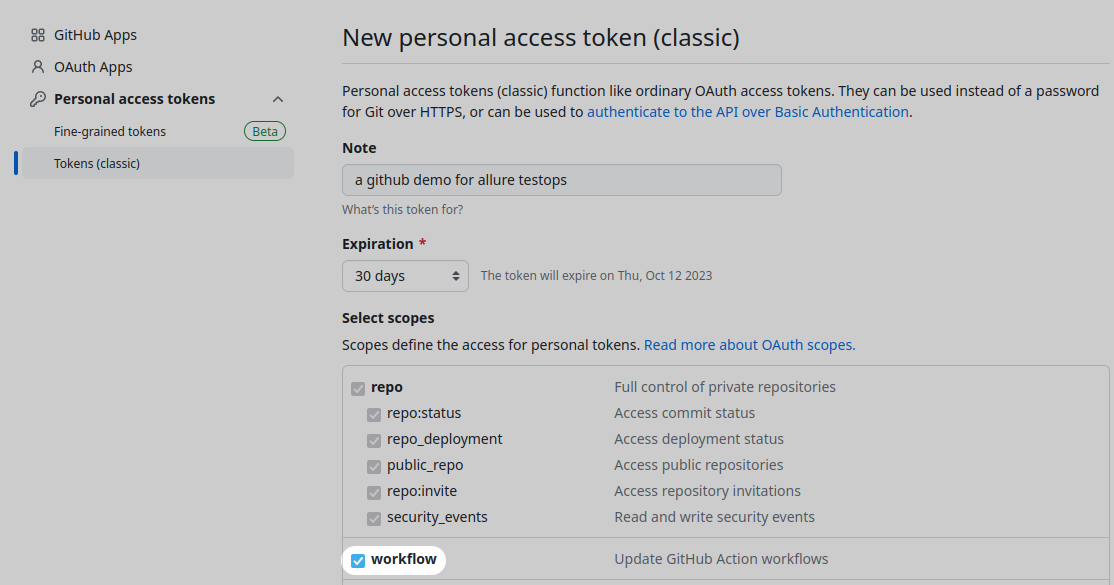
We've got to provide a GitHub token to Allure Testops. When logged in to your account in GitHub, we click the avatar in the upper right corner, select Settings, go all the way down in the list of settings on the left to Developer settings, and then Personal access tokens > Tokens (classic) > Generate new token.
There, we'll get two options: classic or fine-grained token. With classic, we'll need to provide the workflow scope for the token:
With fine-grained, we'll need the following:
- The resource owner has to be able to trigger workflows in the repository that we want to link to Testops.
- The repository itself has to be selected in Repository access.
- Read and write permission has to be enabled for actions.
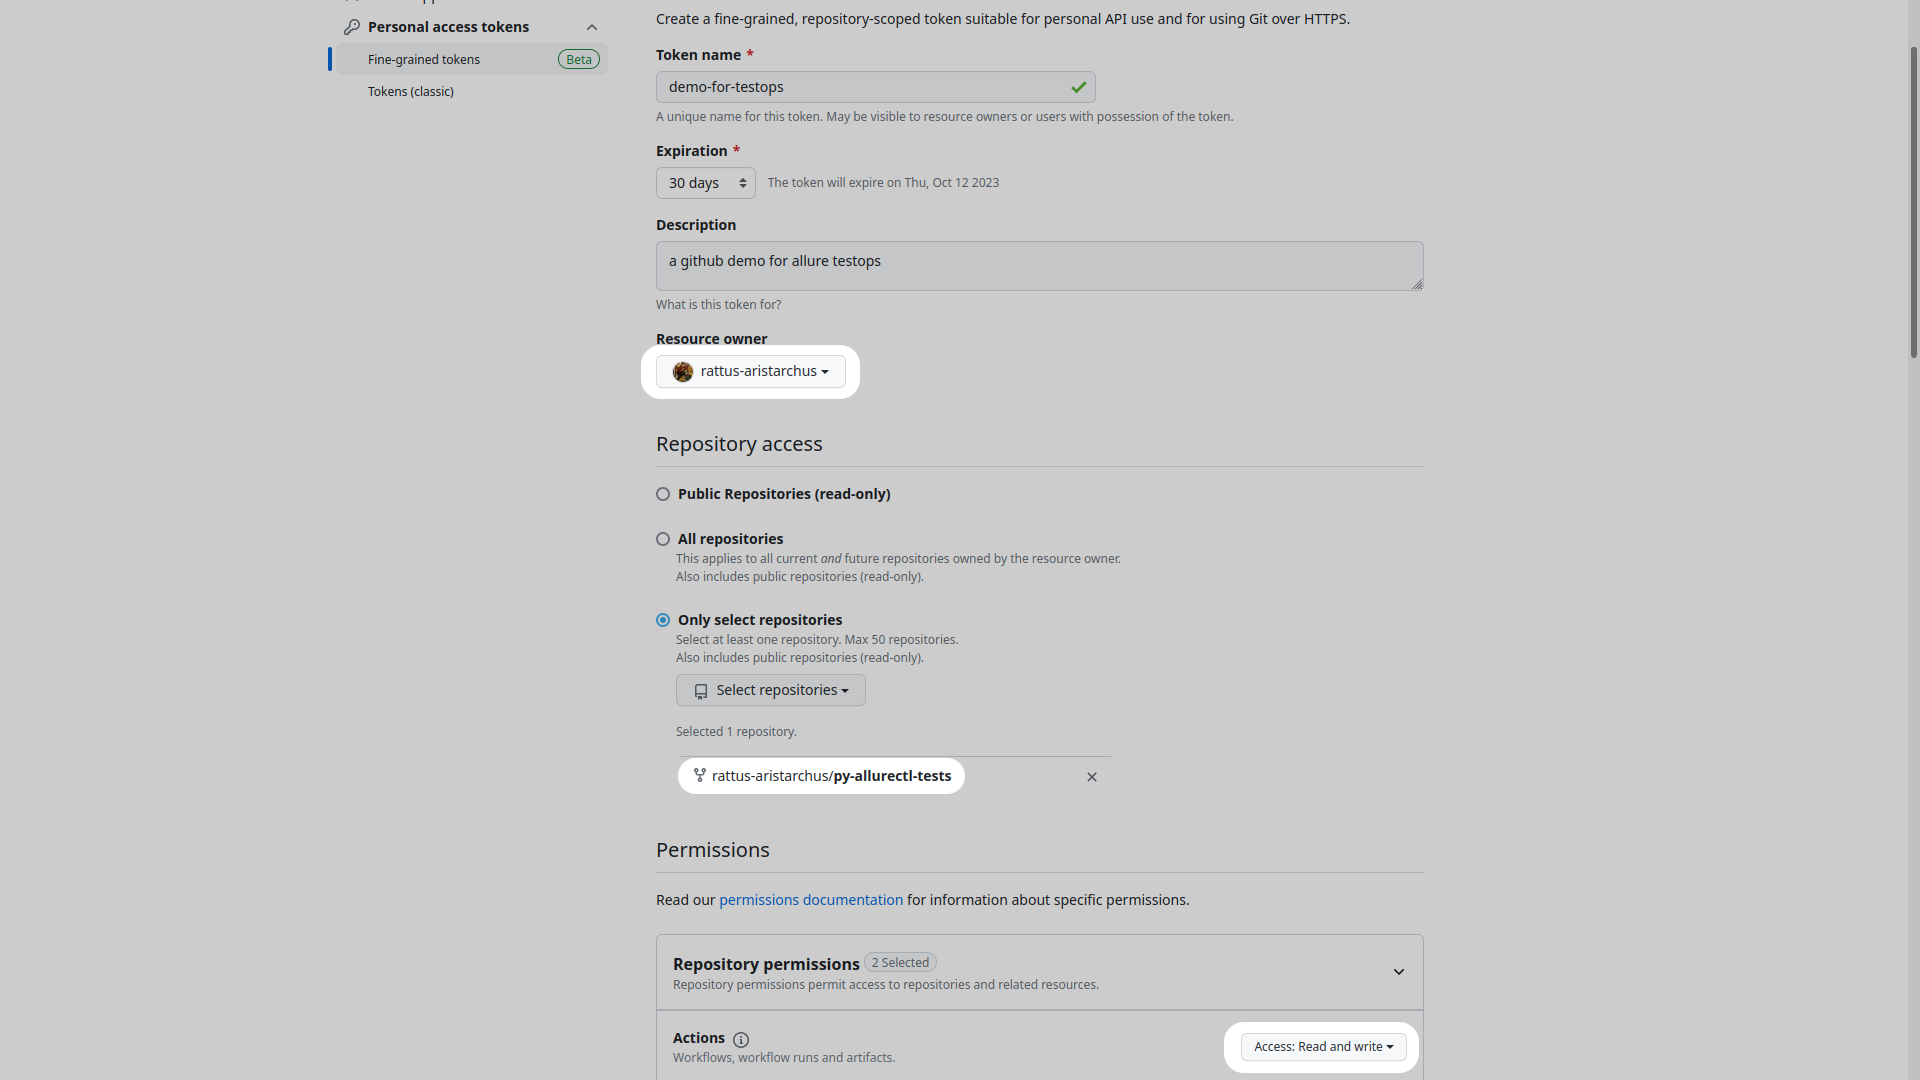
Once the token is generated, we should copy it - it will only be shown once!
Enabling the integration in Allure Testops
The final stage of installation is enabling the integration in Allure Testops. First, it has to be done on the level of the entire Testops system; for that, we'll need admin privileges. Click the avatar in the lower left corner, select Administration, and in the menu on the left, click Integrations. That will present us with a list of all existing integrations; we'll need the Add integrations button in the upper right corner:

There will be a list of everything Testops can integrate with (not just the CI systems). Select GitHub, and fill in the following menu:
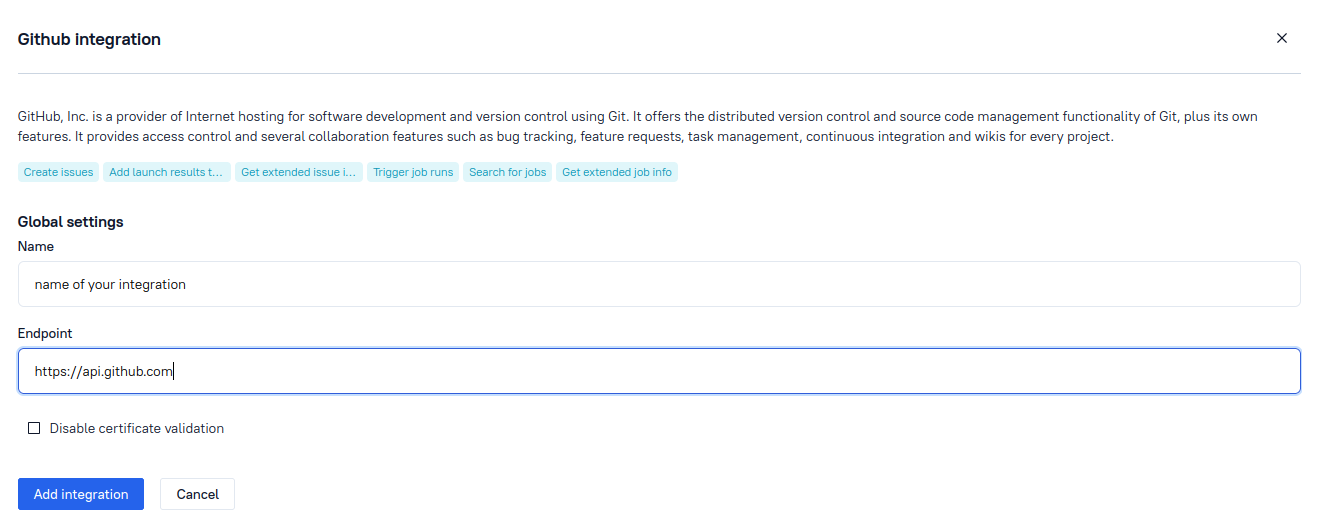
https://api.github.com is the value we need for the endpoint unless we've got in-house GitHub Enterprise, in which case it's http(s)://HOSTNAME/api/v3. Next, click Add integration. In the following menu, we'll be able to test the connection to GitHub, and if it works, the global level is done.
Preparing the project-level integration
Now, we need to enable that integration on the project level (we don't need admin privileges for this part). We go to Settings > Integrations, and there, we'll find all the global integrations that have been added on this Testops server, including the one we've just added above. We need to click Add integration next to it and then enter the GitHub token we've generated before. Next, we click Test connection, and if all is well - Add integration.
And with that, the installation part is done.
Running a job on CI
Now, we can run our workflow. In our GitHub repo, we go to Actions, and on the left, select the workflow we've just set up. Then, we run it:

This is where the magic happens: if everything has been set up correctly, workflow execution can be tracked live on the Testops side.

Once the GitHub icon stops blinking, the job is done.
Generating test cases / test documents
When a launch has finished executing, it should generate test cases automatically. In a new project, the test cases tab will be empty at first. But, as you might remember, we've just executed a launch. Where did it all go?
To generate test cases (or test documentation) from test results or to gain some analytical data about the results, we need first to close the launch - it's that small button with a square to the right of the launch progress bar under Launches:

Once the launch is closed, the test results get processed by Allure Testops. For automated tests, the system will also automatically generate test cases.
There are two options to close the launch: manual and scheduled. We've just covered how to do it manually; to set up automated launch closing by schedule, go to Settings > Launches. There, we can edit the auto-close policy:

In our case, Allure Testops will close the launches after 24 hours once they've executed and after 168 hours if there is still any activity in a launch, such as crashed tests or unexecuted manual tests waiting.
Launching CI runs from Testops
One more thing is going to happen when a launch is closed: a new job is going to be generated under Jobs (unless one exists already):

This one will need a little more configuring: we go to the menu with three dots on the right, then click Configure > Build server, and select our GitHub.
Jobs in Testops are basically links to the CI pipeline. Once we've set one up, we can trigger test runs from the Testops side. It's very convenient: you do it all with just a few mouse clicks, and you can make selective launches, running just the tests for a particular feature, or just failed tests, etc. There is an in-depth guide on how to do it.
Test results overview
The next step of our work with Allure Testops is test results processing. We need to analyze what happened during tests and somehow resolve their output. After we complete these steps, we will generate test cases (or test documentation, as they are sometimes called). Let’s dive into the launch statistics:
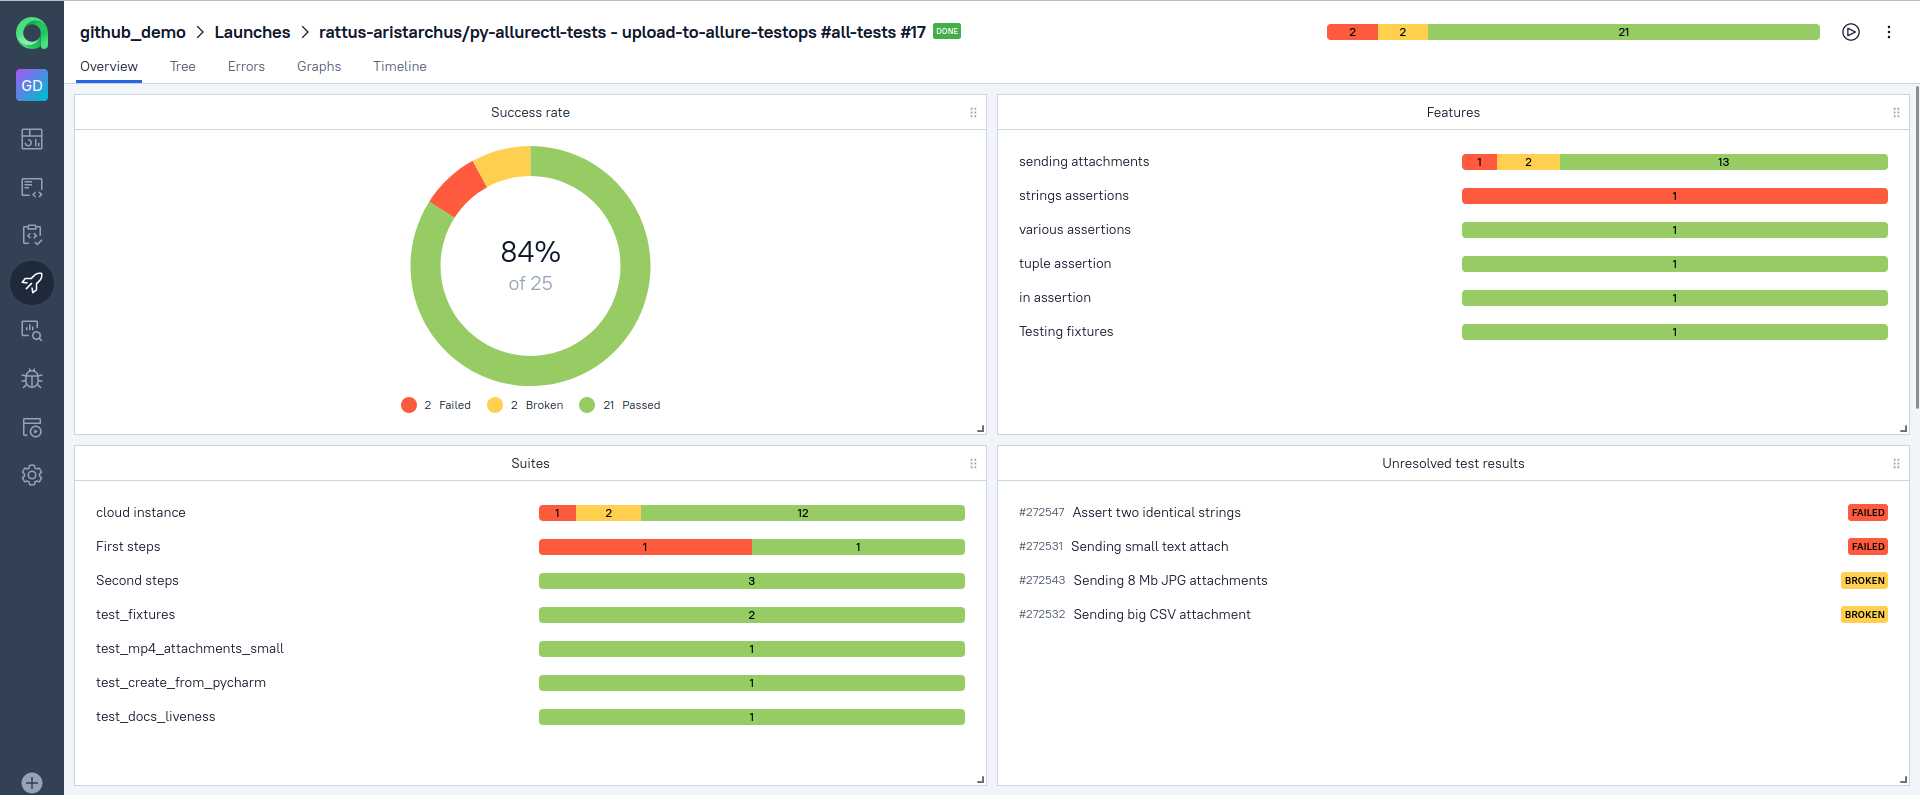
Here, Allure Testops displays data gathered from test cases. In these panels, stats are presented by feature under test and by test case suite. Under Dashboards, we can create custom graphs for whichever metric we need.
As you can see, some of our tests didn't pass. Testops can differentiate between failed and broken tests; right now, we've got two of each (they are all under Unresolved test results). Resolving a test result means either linking it to a defect (="we know why this happened, we're working on it") or muting it (="this is a flaky test, and we don't want it to bother us for now").
The test cases tree
Allure Testops doesn’t have a “folders” view to represent and group test cases. Instead, it uses information provided by the tests. In our case, you can see that our test tells us what feature, story, and suite it belongs to:
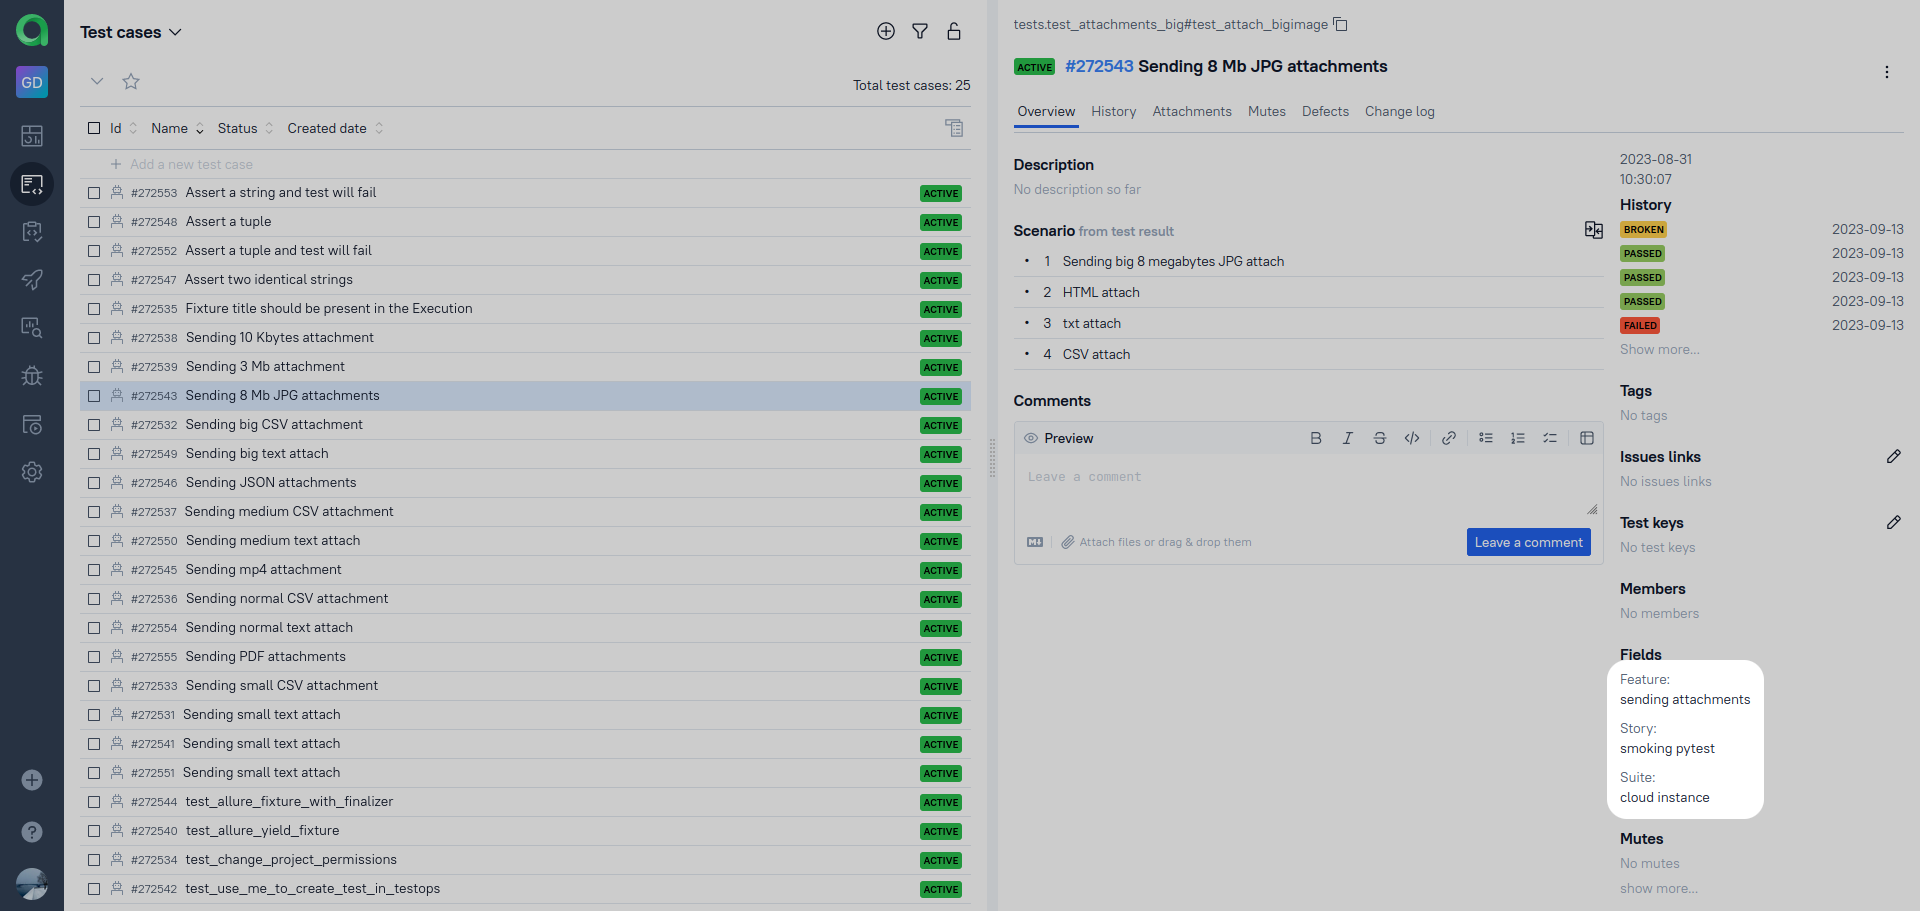
This data is stored in test cases directly if it's a manual test case. For automated tests, it's extracted from the code of the test in question, specifically, from its annotations (you can read more on the Allure doc page of the test framework you're using - e.g. the one for JUnit 5). For instance, here are the annotations for the test the previous screenshot was displaying:
@allure.suite("cloud instance")
@allure.story("smoking pytest")
@allure.feature("sending attachments")
@allure.title("Sending 8 Mb JPG attachments")
@github_issues("rattus-aristarchus/py-allurectl-tests#2")
def test_attach_bigimage():
    # Code of the test continues - right now, it's not important
So, how is that data used to organize tests? The test case list you've just seen is plain and simple. This is fine if we manage a dozen test cases, but how do we navigate several hundreds of tests? That’s the neat part. Allure Testops supports a flexible and powerful test case grouping and filtering system by any custom or default state of the field.
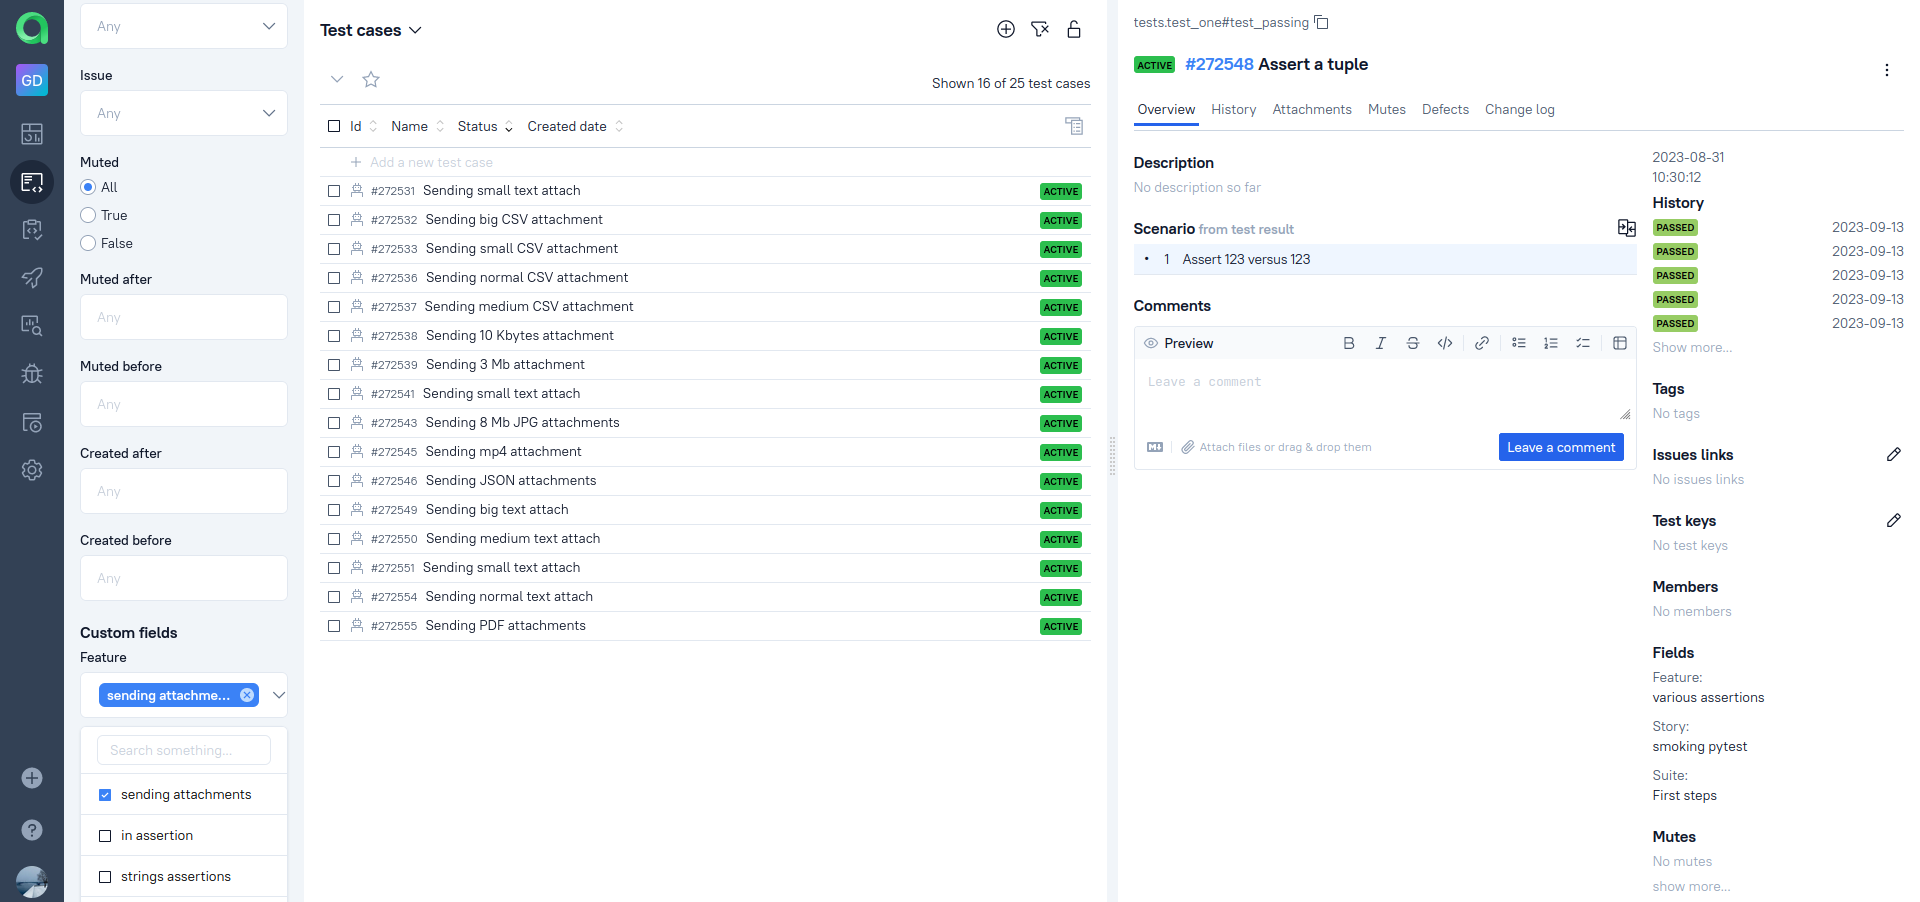
And even without any further setup, we have several views: Features, Suites, or plain list:
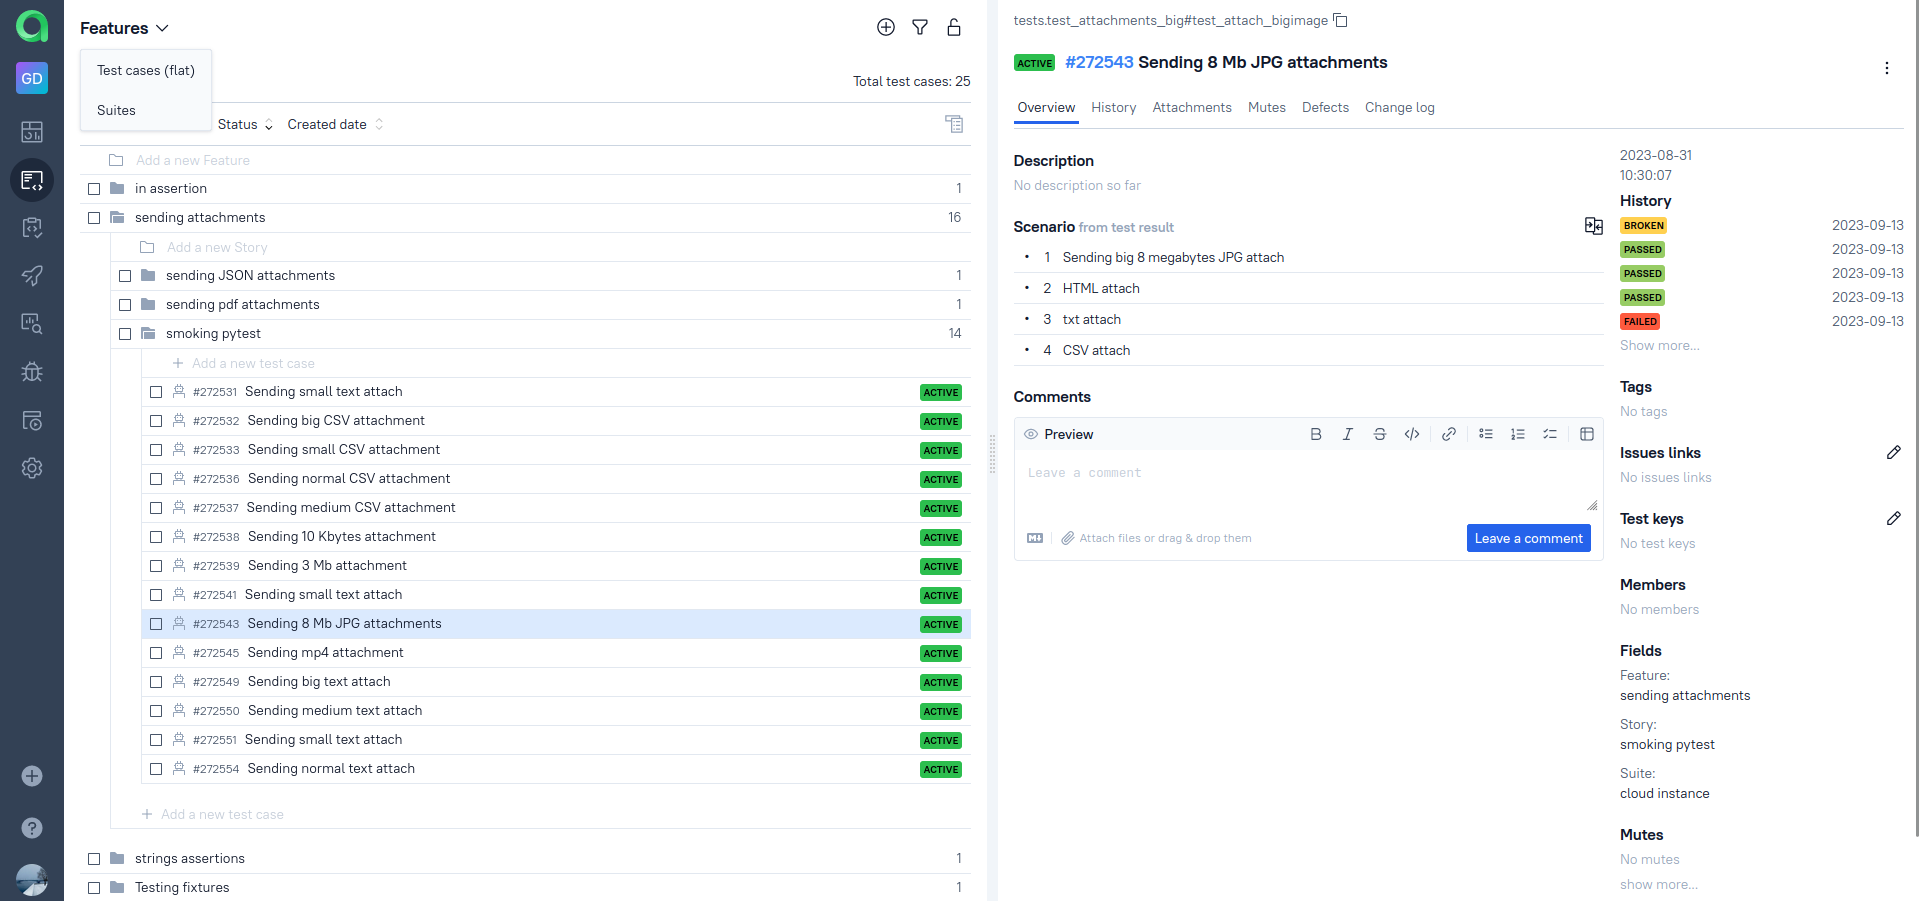
Of course, all of this plays nicely with the selective launches we've discussed earlier - you can select all tests for a particular feature and run them alone.
Each test case contains a lot of data and metadata. In time, you’ll start using the history, defects, and changelog tab for a test case.
- The History tab contains all the data about runs of a particular test.
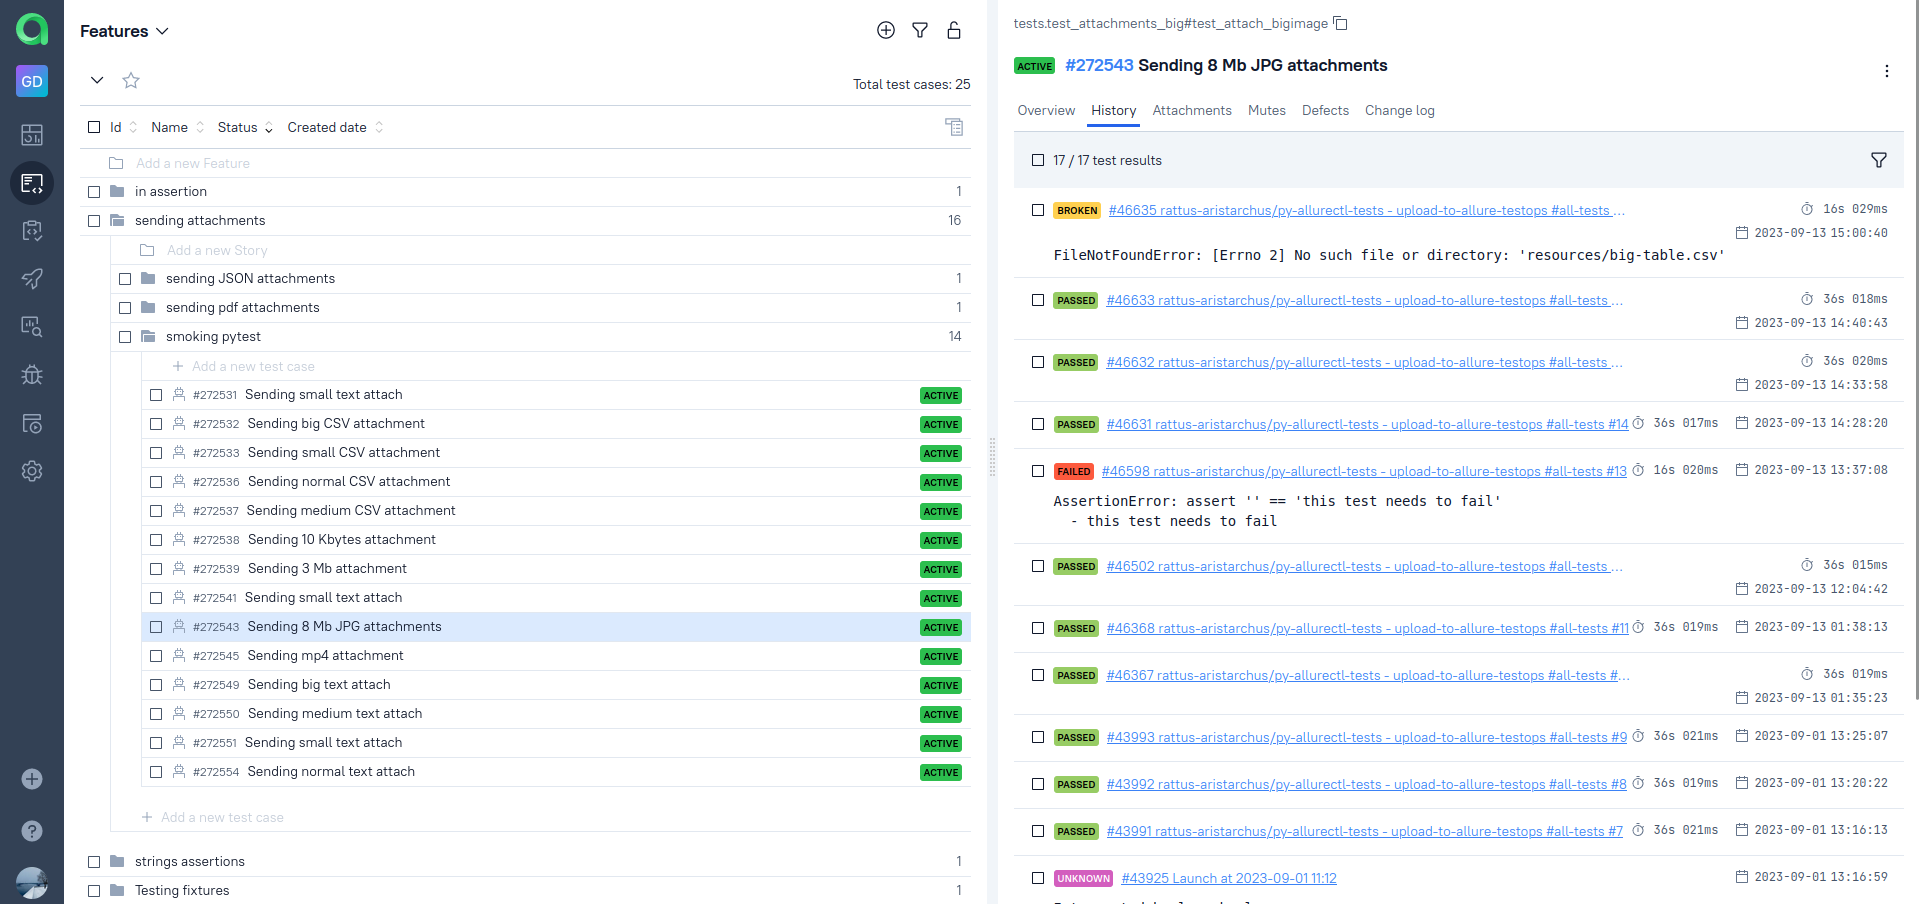
- The Defects tab shows the states of defects linked to a TC.
- The Changelog provides a GitHub-like UX for managing and backtracking all the test case updates: tags, statuses, issue-trackers linking, layers, and configuration. No more investigation of who and when changed a test or why a layer label has been deleted.
Analysis, defects
It is time to take a closer look at the execution results of a test. We'll take one of the broken ones. Under Execution, we can see what happened during each step of our test:
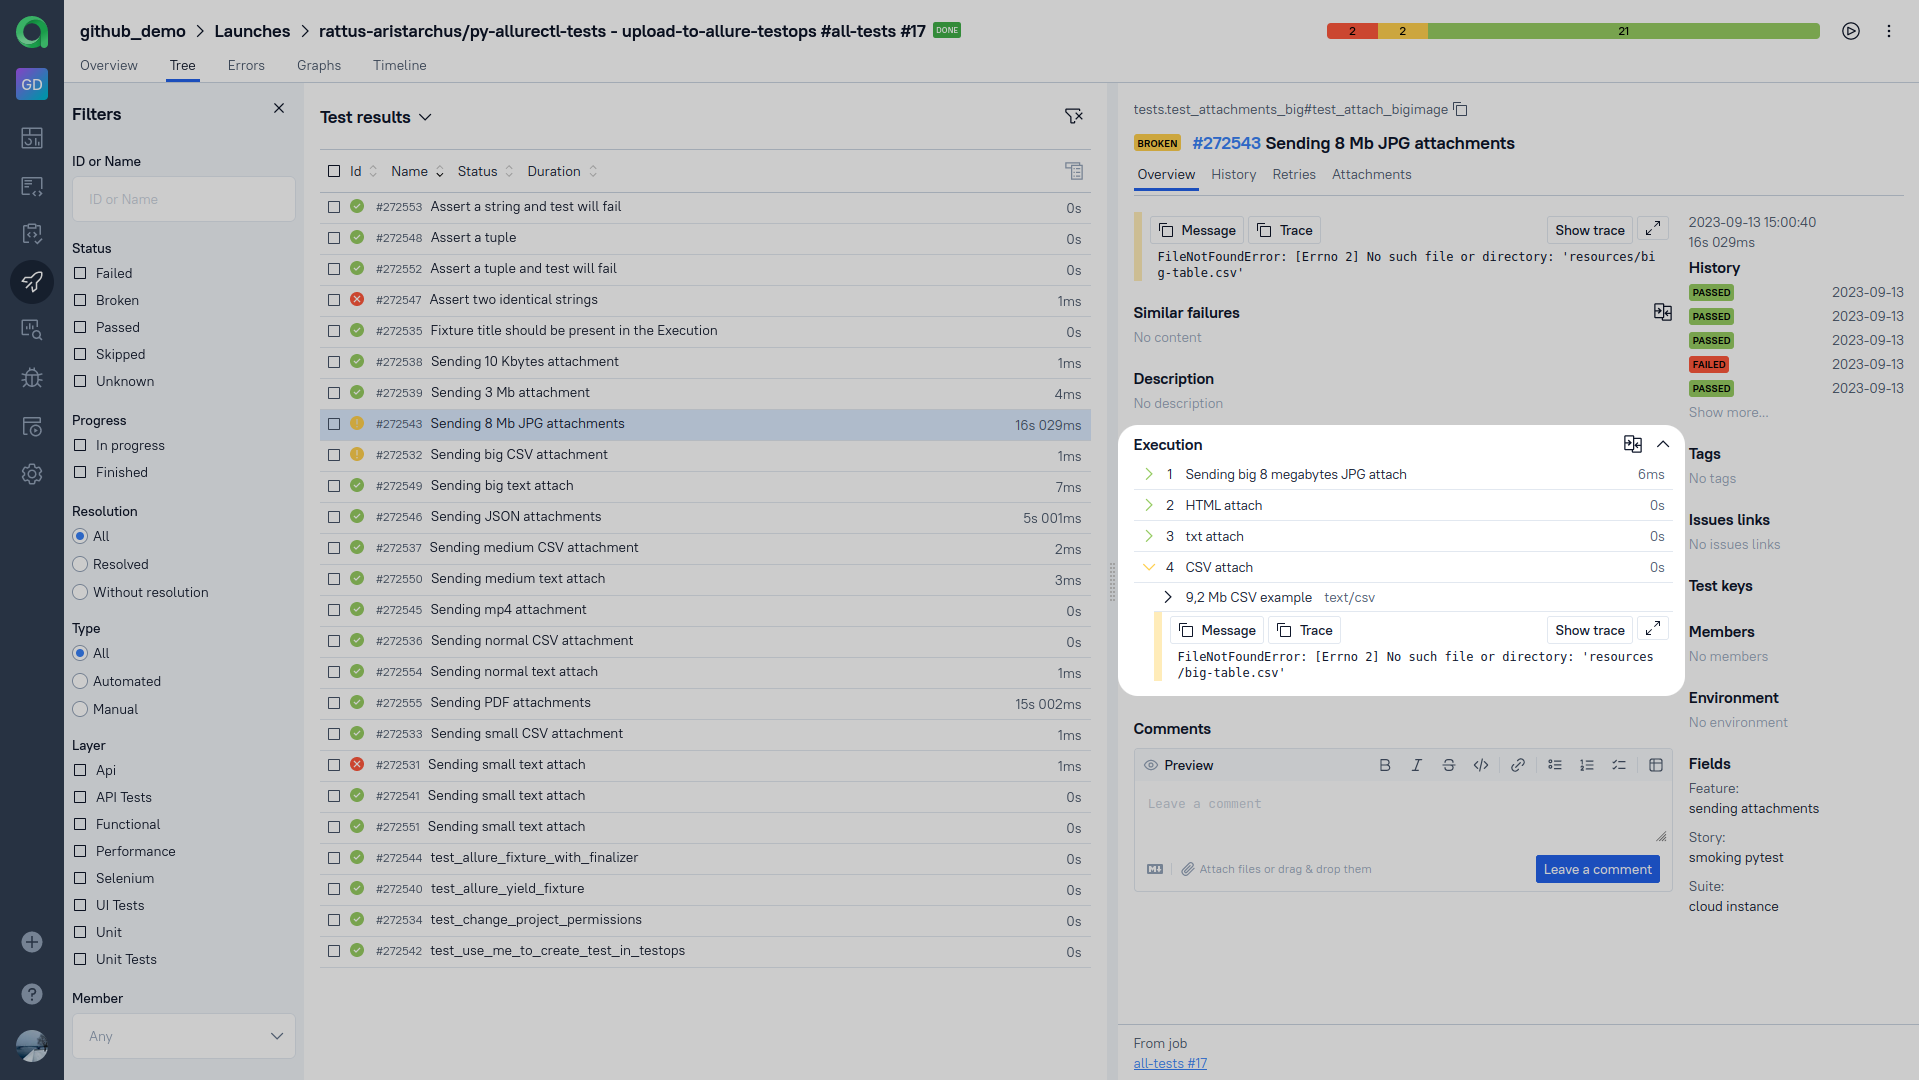
In this case, it looks like we've forgotten to add a resource to our code base, a .csv table. Everything was fine, right until we tried to load it.
As it turns out, another test relied on that table (Sending big CSV attachment) - and it's broken now, too. This is why we need defects - they link multiple errors caused by the same problem. Moreover, they can recognize the problem automatically, thus drastically reducing the time it takes to sort test results. We've got a detailed guide on defects and a doc page if you'd like to know more.
Conclusion
Allure Testops is a full-stack testing platform. It allows you to control the entire testing flow from one place: launch test runs, monitor their execution live, and dig into the test results. We've taken pains to automate as much of that workflow as possible. Launching test runs is done with a few mouse clicks, even if you need selective test runs. Tests can be displayed in trees organized by whichever parameter you need. Test cases are updated automatically with test results once a launch is closed. Thanks to the defects feature, a large chunk of failed or broken tests is sorted automatically. Finally, we've unified the Testops side of installing new integrations to make the process smoother, and we've been getting some positive feedback from admins on that. If you want your manual and automated testing to be on friendly terms, Allure Testops is what you need!
