Alexander Abramov and Maksim Rabinovich, QA engineers at Wisebits, an international IT company and industry trendsetter, tell the story of how they went from half-manual chaotic testing to fully automated, organized multi-platform and multi-device testing.
Background
The project was relatively small with only a handful of developers and a couple of testers. The technology stack included:
- PHP 7.4 and Codeception
- Selenoid Framework
- GitLab CI/CD
- Manual Tests Reporting: Zephyr TMS
- Automated Testing Reporting: Codeception embedded reporter
Zephyr had an awesome JIRA integration that allowed it to maintain testing documentation in the tracker and create JQL-configured dashboards. The team was generally happy with this but getting answers for some queries e.g. a complete list of manual and automated tests and checking the coverage of testing was laborious, they wanted something more efficient.
The Challenge and the Choice
Consequently, the team pursued two goals:
- To automate test runs on each developer's pull request. The idea being that at each pull request GitLab creates a new branch with a name and commit sha-ref and a pipeline with the linked tests. The task was to clarify which tests have been run on each branch/commit.
- To have one location for both manual and automated test reporting and insights.
After several unsuccessful experiments to integrate manual and automated reports, there were still two separate test reports. Merging these separated reports into actionable and insightful analytics took lots of time. Moreover, manual testers complained about the UI/UX of test scenario editing in Zephyr.
These two factors forced Wisebits engineers to start the long journey of looking for a better solution.
TestRail
The first attempt was TestRail. It was a great solution to store test cases and test plans, run the tests, and show fancy reports, however, it did not fix the problem of automation and manual testing integration.
TestRail provides API documentation for automation integration, which the Wisebits team used, and they even made an implementation of test run and status updates for each test but the development and maintenance of the integration turned out to be extremely time-consuming, so the journey for something more efficient continued.
Allure TestOps
After Zephyr and TestRail there was no room for error. Much time was spent exploring various options: studying internet forums holywars, listening to colleagues' advice, reading many books, and having long discussions.
In the end, at one of the testing conferences, we discovered Allure TestOps, an all-in-one DevOps-ready testing infrastructure solution.
The First Try
We deployed a TestOps instance via docker-compose and saw a login screen. A screen promising a long-long way.
The very first Allure TestOps screen
First of all, we set up report uploading via allurectl. We have a GitLab CI/CD where some tests run in Docker containers, and others run on test benches. Let's create a dockerfile and make allurectl executable (here is an x86 example):
FROM docker/compose:alpine-1.25.5

RUN apk add \\
   bash \\
   git \\
   gettext

ADD <https://github.com/allure-framework/allurectl/releases/latest/download/allurectl_linux_386> /bin/allurectl

RUN chmod +x /bin/allurectl
Second, we configured allure-start and allure-stop jobs so that the pipeline would run the allurectl script when tests run on CI and fetch the results to Allure TestOps.
See the allure-start example below:
allure-start:
  stage: build
  image: //your project image
  interruptible: true
  variables:
    GIT_STRATEGY: none
  tags:
    - //if needed
  script:
    - allurectl job-run start --launch-name "${CI_PROJECT_NAME} / ${CI_COMMIT_REF_NAME} / ${CI_COMMIT_SHORT_SHA} / ${CI_PIPELINE_ID}" || true
    - echo "${CI_PROJECT_NAME} / ${CI_COMMIT_REF_NAME} / ${CI_COMMIT_SHORT_SHA} / ${CI_PIPELINE_ID} / ${CI_JOB_NAME}"
   rules:
   - if: //configure rules and conditions below if needed
     when: never
   - when: always
 needs: []
And this is how allure-stop might look like:
allure-stop:
  stage: test-success-notification
  image: //your project image
  interruptible: true
  variables:
    GIT_STRATEGY: none
  tags:
    - //if needed
  script:
    - ALLURE_JOB_RUN_ID=$(allurectl launch list -p "${ALLURE_PROJECT_ID}" --no-header | grep "${CI_PIPELINE_ID}" | cut -d' ' -f1 || true)
    - echo "ALLURE_JOB_RUN_ID=${ALLURE_JOB_RUN_ID}"
    - allurectl job-run stop --project-id ${ALLURE_PROJECT_ID} ${ALLURE_JOB_RUN_ID} || true
  needs:
    - job: allure-start
      artifacts: false
    - job: acceptance
      artifacts: false
  rules:
    - if: $CI_COMMIT_REF_NAME == "master"
      when: never
It's important to note that Allure, via your testing framework, creates an allure-results folder in {project_name}tests/_output. All you need to do is upload the artifacts created after the test run via the allurectl console command:
.after_script: &after_script
  - echo -e "\\e[41mShow Artifacts:\\e[0m"
  - ls -1 ${CI_PROJECT_DIR}/docker/output/
  - allurectl upload ${CI_PROJECT_DIR}/docker/output/allure-results || true
In addition, we have implemented failed tests notifications to Slack. It's easy — fetch the launch id and grep it like this:
if [[ ${exit_code} -ne 0 ]]; then
 # Get Allure launch id for message link
 ALLURE_JOB_RUN_ID=$(allurectl launch list -p "${ALLURE_PROJECT_ID}" --no-header | grep "${CI_PIPELINE_ID}" | cut -d' ' -f1 || true)
 export ALLURE_JOB_RUN_ID
Ultimately, our tests run in Docker using a local environment. That starts the allure-start job and creates a place to upload tests later.
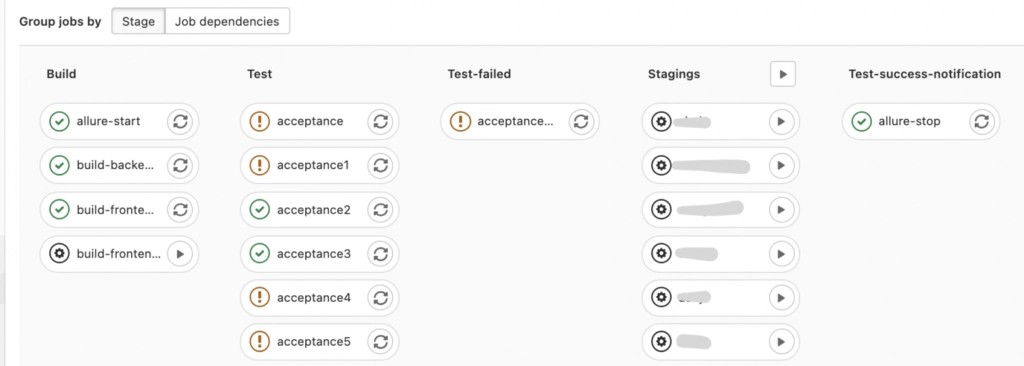
This is how a pipeline might look like
We have also configured the Parent-child pipeline to deploy a branch to a physical testing instance and run a set of tests on it. To do so, we fetch all the necessary variables (${CI_PIPELINE_ID} and ${PARENT_PIPELINE_ID}) and make sure that all the results are stored in a single Allure TestOps launch:
.run-integration: &run-integration
  image:
  services:
    - name: //your image
      alias: docker
  stage: test
  variables:
    <<: *allure-variables
  tags:
    - //tags if needed
  script:
    - echo "petya ${CI_PROJECT_NAME} / ${CI_COMMIT_REF_NAME} / ${CI_COMMIT_SHORT_SHA} / ${CI_PIPELINE_ID} / ${PARENT_PIPELINE_ID} / ${CI_JOB_NAME} / {$SUITE}"
    - cd ${CI_PROJECT_DIR}/GitLab
    - ./gitlab.sh run ${SUITE}
  after_script: *after_script
  artifacts:
    paths:
      - docker/output
    when: always
    reports:
      junit: docker/output/${SUITE}.xml
  interruptible: true
At last, we got the first results. It took us a whole Friday to set up and get tests with steps and a pie chart with results but it meant that for each commit or branch creation the necessary test suite was run and the results were returned to Allure. Our first win!
Automated Tests Integration
However, we had a shock when it came to looking at the automated tests tree — we found an unreadable structure that looked like this:
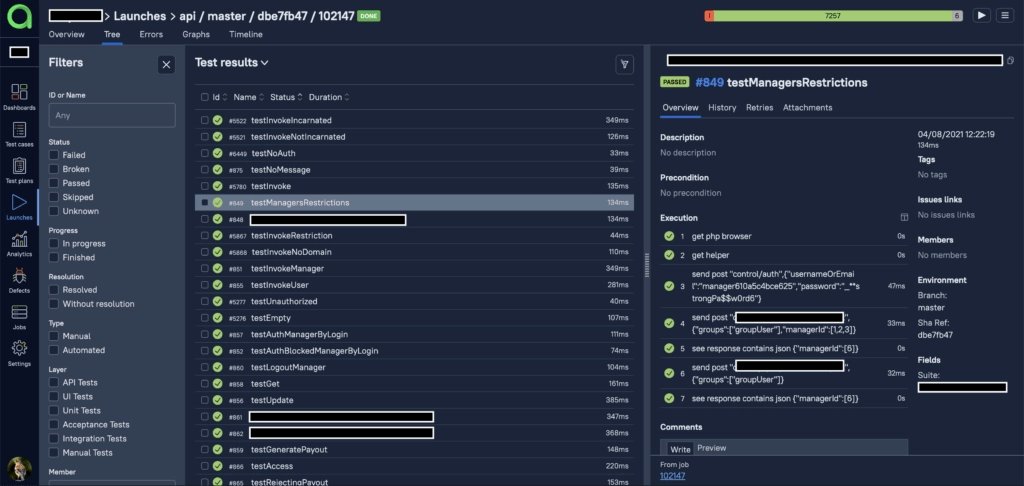
The tree is built on the principle 'Test Method name + Data Set #x'.
Steps were named like multiple "get helper", "wait for element x", or "get web driver" without any details about what exactly happens within the step. If a manager was to see such a test case, there would be more questions than answers and unfortunately, there is no way to solve this issue in a couple of clicks!
In fact, we spent almost two weeks refactoring the automation codebase, annotating each test with metadata, and wrapping each step in human-readable names to benefit the TestOps flexibility of test case management.
The usual metadata description in PHP adapted Javadoc looks like this:
/**
     * @Title("Short Test Name")
     * @Description("Detailed Description")
     * @Features({"Which feature is tested?"})
     * @Stories({"Related Story"})
     * @Issue({Requirements})
     * @Labels({
     *     @Label(name = "Jira", values = "SA-xxxx"),
     *     @Label(name = "component", values = "Component Name"),
     *     @Label(name = "layer", values = "the layer of testing architecture"),
     * })
*/
In the end, you'll get something like this:
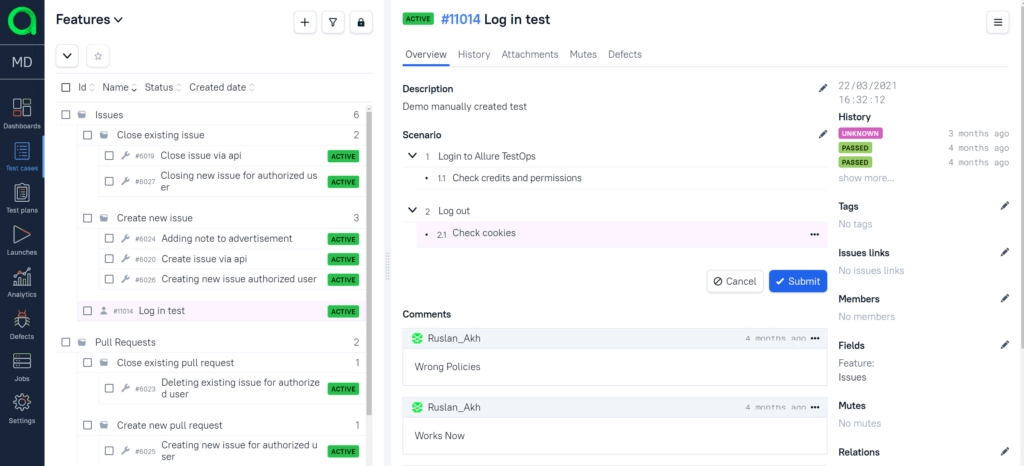
This is the "Group by Features" view. In two clicks, the view may be changed to different grouping, filtering and order.
Next, the automated test steps need to be put in order. We used the Allure method executeStep as a wrapper. In this example, we give a human-readable step text to the method signature as the first parameter of the addInvite method:
public function createInviteCode(User $user, string $scheme): Invite
{
   return $this->executeStep(
       'Create invite code for ' . $user->username . ' with ' . $scheme,
       function () use ($user, $scheme) {
           return $this->getHelper()->addInvite(['user' => $user, 'schemeType' => $scheme]);
       }
   );
}
By doing this, we can hide all the realization details under the hood, and the steps are given readable names. In the Allure TestOps UI the test starts looking like this:
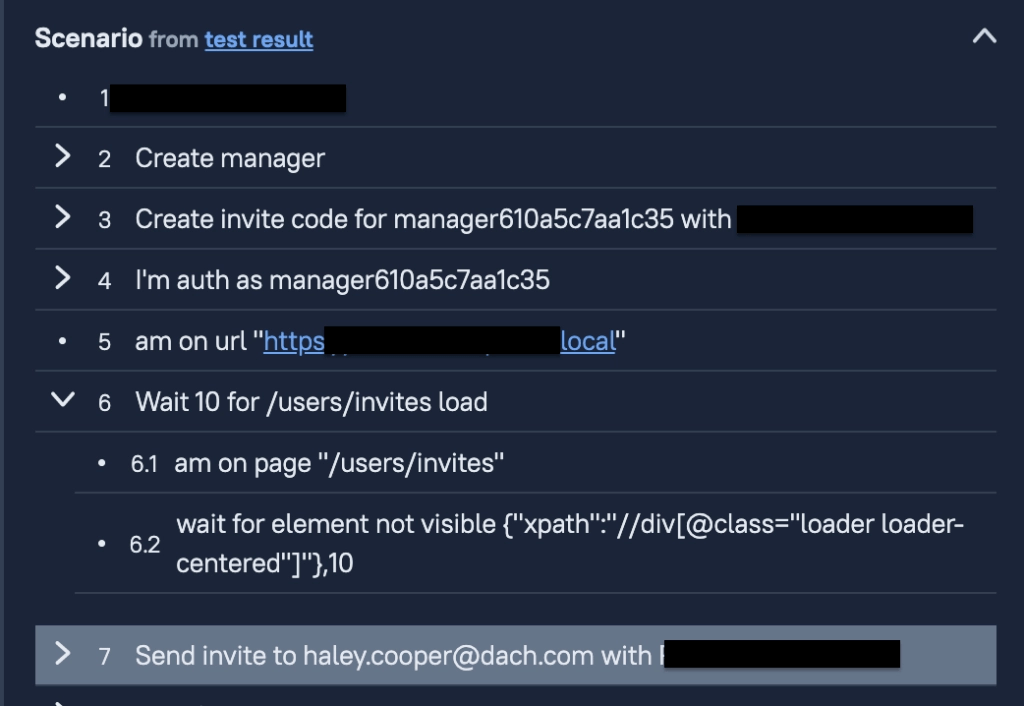
Automation Success
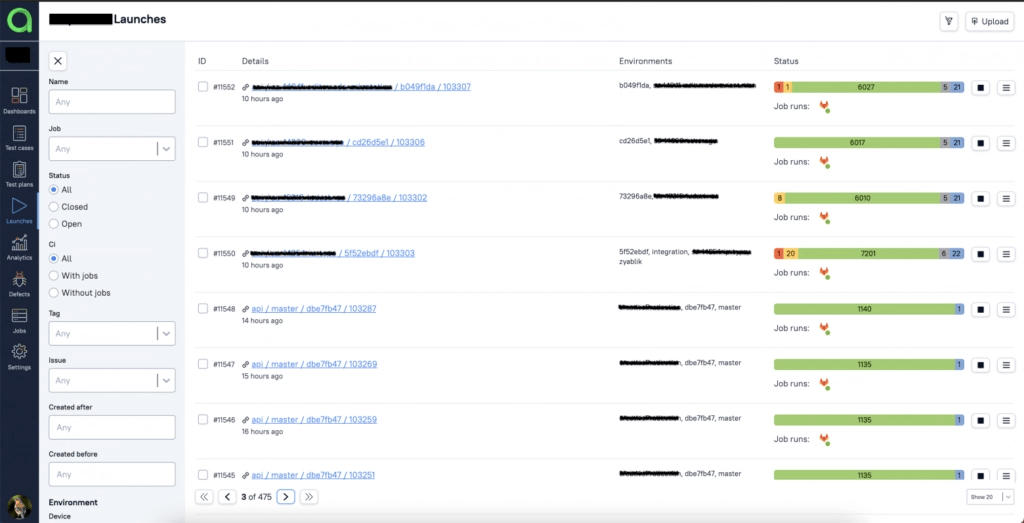
At this point, we achieved the first journey milestone: a Launches page in Allure TestOps. This allows you to see all the Launches on branches/commits and access the list of tests for each launch. We have also got a flexible view constructor for testing metrics dashboarding: tests run; passed and failed tests statistics; etc.
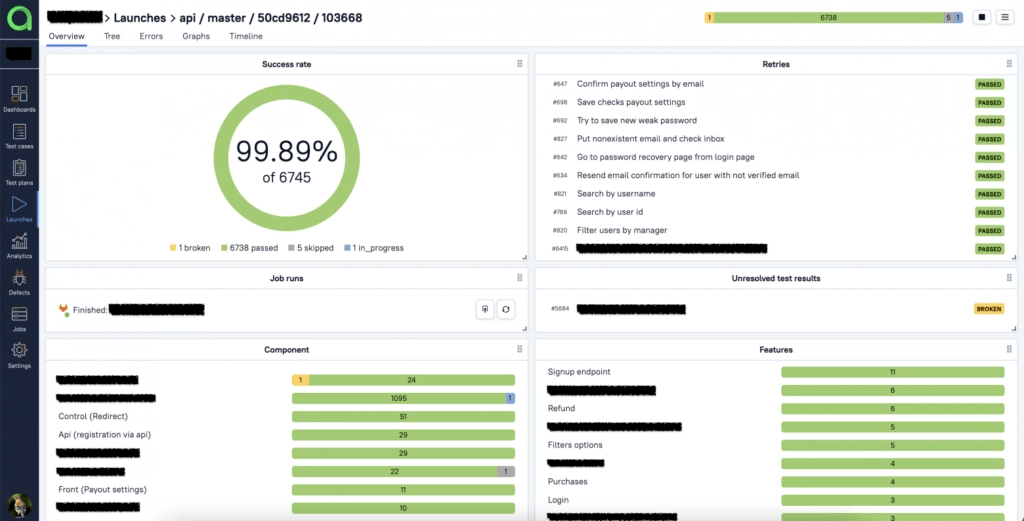
Entering a Launch also provides more details: components or features involved, number of reruns, test case tree data, test duration, and other information.
And there is one more mind-blowing feature: Live Documentation that automatically updates test cases.
The mechanics are elegant. Imagine that someone updates a test in the repository, and the test gets executed within a branch/commit test suite. As soon as the Launch is closed, Allure TestOps updates the test case in UI according to all the changes in the last run. This feature lets you forget about manual test documentation updates.
Manual Testing Integration
With automation working well, the next step was to migrate all the manual tests from TestRail to Allure TestOps. A TestRail integration provides a lot of flexibility to import the tests to Allure TestOps, but the challenge was to adapt them all to an Allure-compatible logic.
The default logic is built on the principle that a test case contains a finished scenario while the expected result stays optional. In case an expected result is needed, it goes to a nested step:

For those that enjoy a precondition style, there is an option to choose this structure for a project:
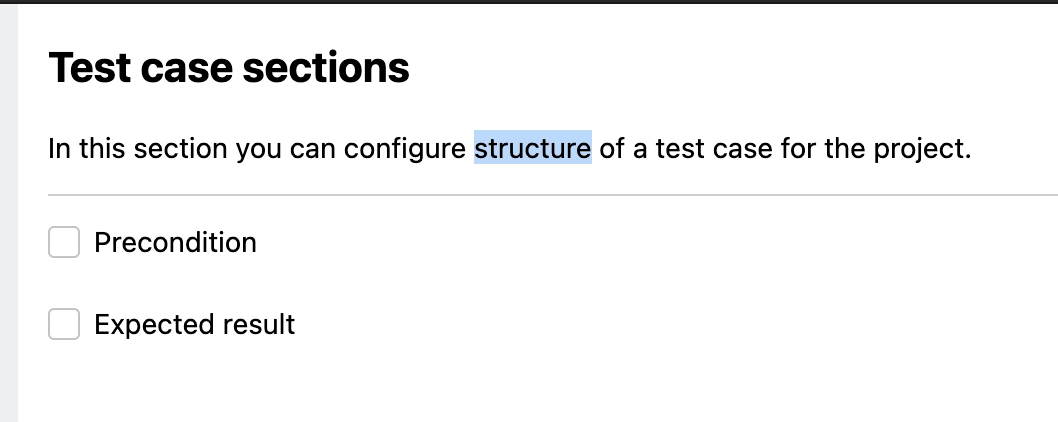
In the end, we had to adapt a lot of our manual tests to the new structure. It took some time but we built a database that contained both manual and automated tests in one place with end-to-end reporting. We were ready to present the result to colleagues and management, or were we?
Nope! On the day before the presentation, we decided to set all the reports and filters up to demonstrate how it all worked. To our shock, we discovered that the test case tree structure was completely messed up! We quickly investigated the problem and found that the automated tests were structured by code annotations while manual ones were created via UI without the corresponding annotations. It led to confusion in the test documentation and test result updates after each run on the main branch.
Test Cases as Code concept: the main idea is to create, manage, and review manual test cases in the code repository via CI.
To fix this issue we rebuilt the test case tree and left manual tests out. We spent more time in research and found the Test Cases as Code concept. The main idea of the concept is to create, manage, and review manual test cases in the code repository via CI.
This solution is easily supported in Allure TestOps: we just create a manual test in code, mark it with all the necessary annotations, and then put the MANUAL label. Like this:
   /*
    * @Title("Short title")
    * @Description("Detailed description")
    * @Features({"The feature tested"})
    * @Stories({"A story"})
    * @Issues({"Link to the issue"})
    * @Labels({
      *     @Label(name = "Jira", values = "JIRA ticket id"),
      *     @Label(name = "component", values = "Conponent"),
      *     @Label(name = "createdBy", values = "Test Case author"),
      *     @Label(name = "ALLURE_MANUAL", values = "true"),
    * })
            @param IntegrationTester $I *Integration Tester
      @throws \\Exception*
    */
  public function testAuth(IntegrationTester $I): void
    {
    &I -> step(text: 'Open google.com')
    &I -> step(text: 'Accept cookies')
    &I -> step(text: 'Click Log In button')
    &I -> subStep(text: 'Enter credentials', subStep: 'login: Tester, password:blabla')
    &I -> step(text: "Expect name Tester")
    }
The step the method is simply a wrapper for the internal Allure TestOps executeStep method. The only difference between a manual and an automated test is the ALLURE_MANUAL annotation. On the launch start, manual tests get an "In progress" state that indicates the test case must be executed by manual testers. The launch will automatically balance manual tests among the testing team members.
The Test Cases as Code approach also allows you to go further and create manual test actors, create methods and use them as shared steps in manual tests. This is up to you to do so.
At this point, we had happily got all the tests stored and managed in Allure TestOps with reporting, filtering, and dashboards now working as expected, and moreover, we had achieved our two goals!
Dashboards and reports
Speaking of dashboards, Allure TestOps provides a special "Dashboards" section containing a set of small customizable widgets and graphs. All the tests, numbers, launches, usage and result statistics data are available on a single screen.
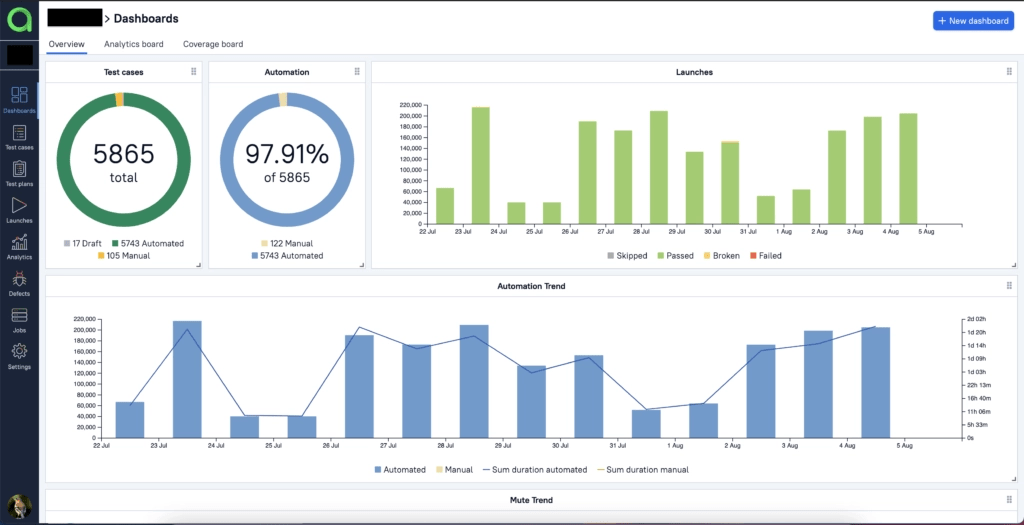
As you see, the Test Cases pie chart shows the total number of test cases, and the Launches graph provides some details about the number of test executions by day. Allure TestOps provides more views and a flexible JQL-like language for custom dashboards, graphs and widgets configuration. We really loved the Test Case Tree Map Chart, the coverage matrix, that allows estimating automation and manual coverage sorted by feature, story, or any other attribute you define in your test cases.
Benefits
Testing is now fully integrated in development and operation cycle;
All the tests are stored and managed in a single place;
Managers have 24/7 access to testing metrics and statistics;
The Wisebits team reviewed and updated lots of test during migration;
Easy testing infrastructure migration due to diverse native integrations.


