All open-source projects take great satisfaction in knowing that people use their work. We hope that the community around Allure Report will continue to flourish and that our efforts will have a positive impact on the lives of as many individuals as possible. Let's see how our project has been performing and what usage patterns there were in March 2023.
Allure Report is an open-source lightweight multi-language test report tool maintained by Qameta Software.
Usage rates by country
First, a disclaimer: our analytics is restricted as it is solely based on data from users who report on public networks while keeping their statistics anonymous. Hence, the results may not be comprehensive, but we believe they provide a reasonable representation.
With that out of the way, let's take a look at usage rates by country:
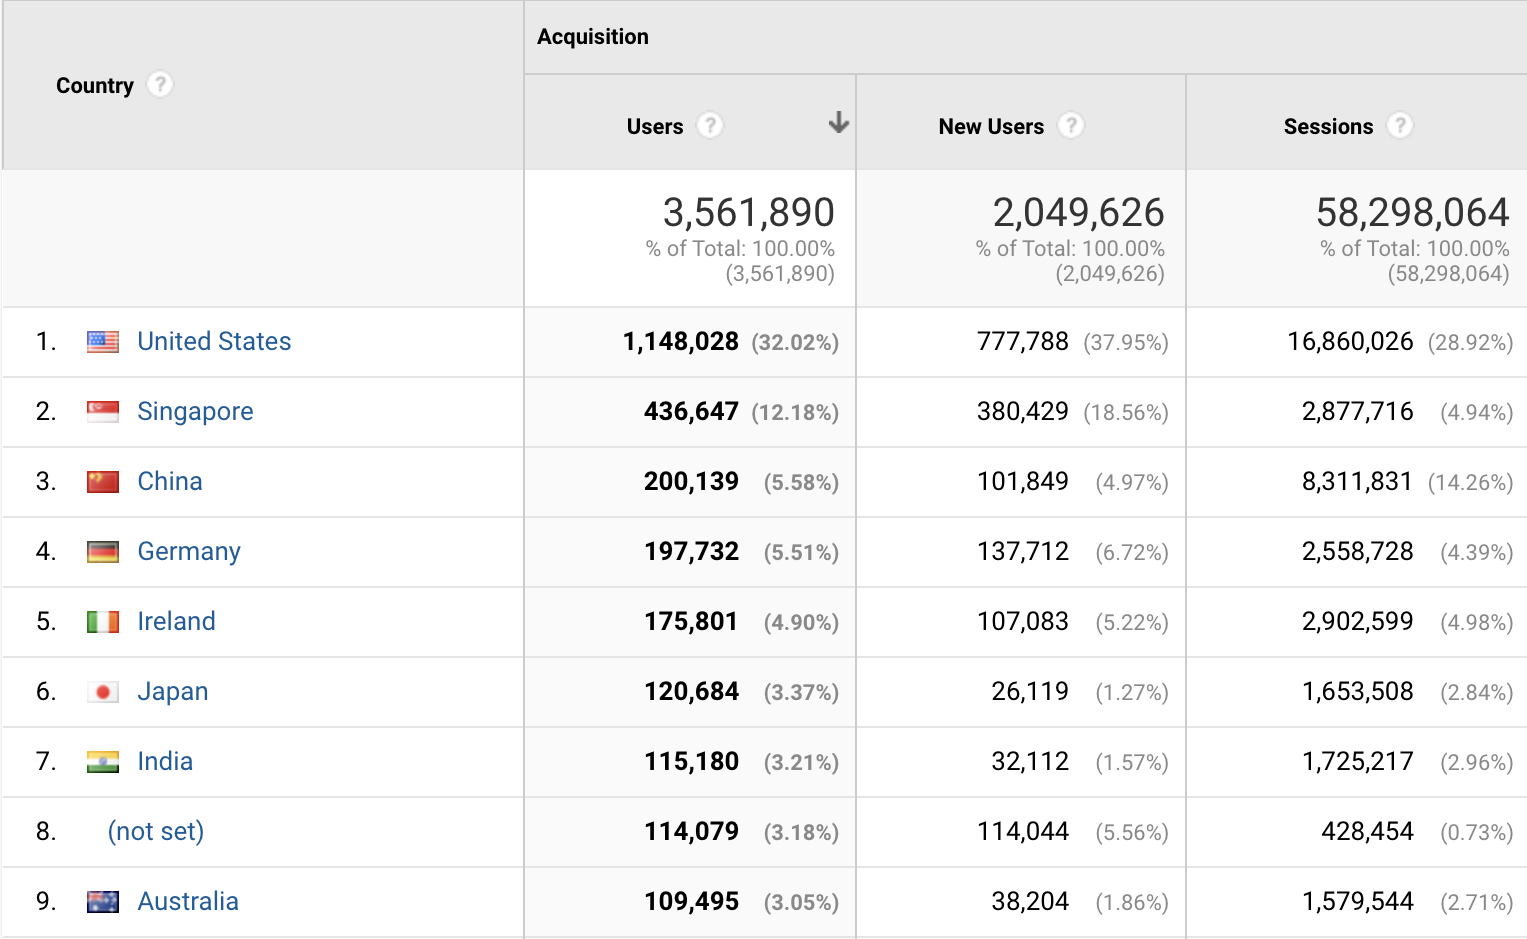
Like last year, communities from the US, China, Germany, and Ireland are among the largest. But this year, Singapore is beating most of them, taking second place with 437k users. Moreover, its share among new users is even larger than among all users, which means that it is still going upwards. The same can be said about Germany and the US. On the other hand, China's share among new users is lower than among users in general, so it's growing slower.
Despite this, the Chinese community generates several times more reports than Singapore, Germany, and Ireland, while having roughly the same amount of users - so China clearly goes for a different scale. Just to confirm this, let's take a look at sessions per user by country:
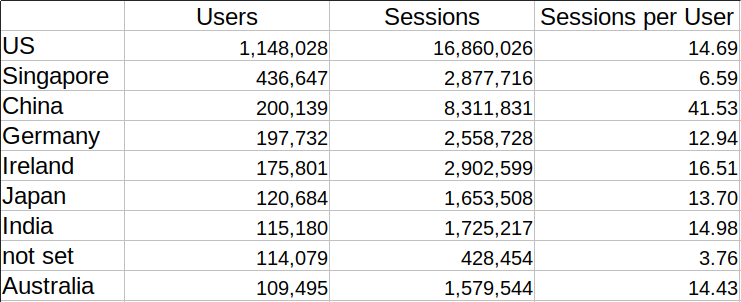
As we can see, most communities hover around 12-16 sessions per user (with 16 being the average). However, the Chinese community is at 41. If we remember that they also have fewer new users than other countries, this probably tells us that their user base has fewer early adopters and more established users.
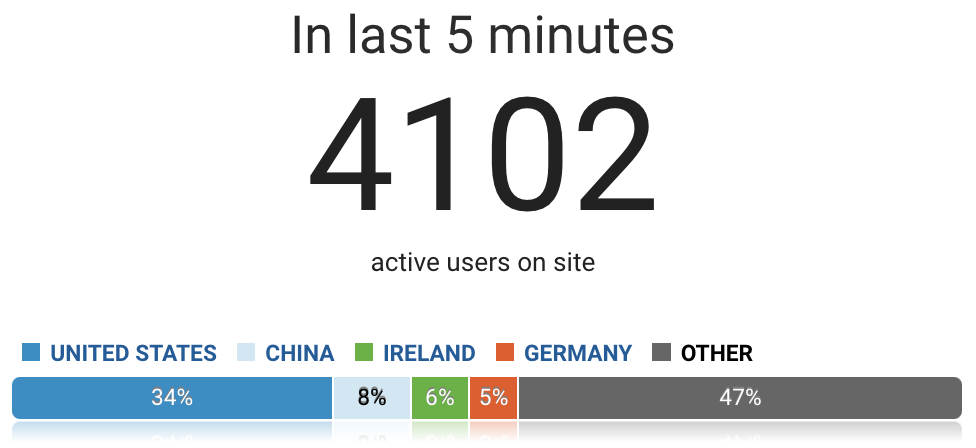
Wrapping it up with geography, if we look at the number of users on our site in the last 5 minutes, we'll mostly see people from the same countries as before: the US, China, Ireland, and Germany.
Frequency of usage
Next, let's see which users are responsible for most of the sessions. For that, we'll group our users by the number of sessions they've run and count the total number of sessions in each bracket:
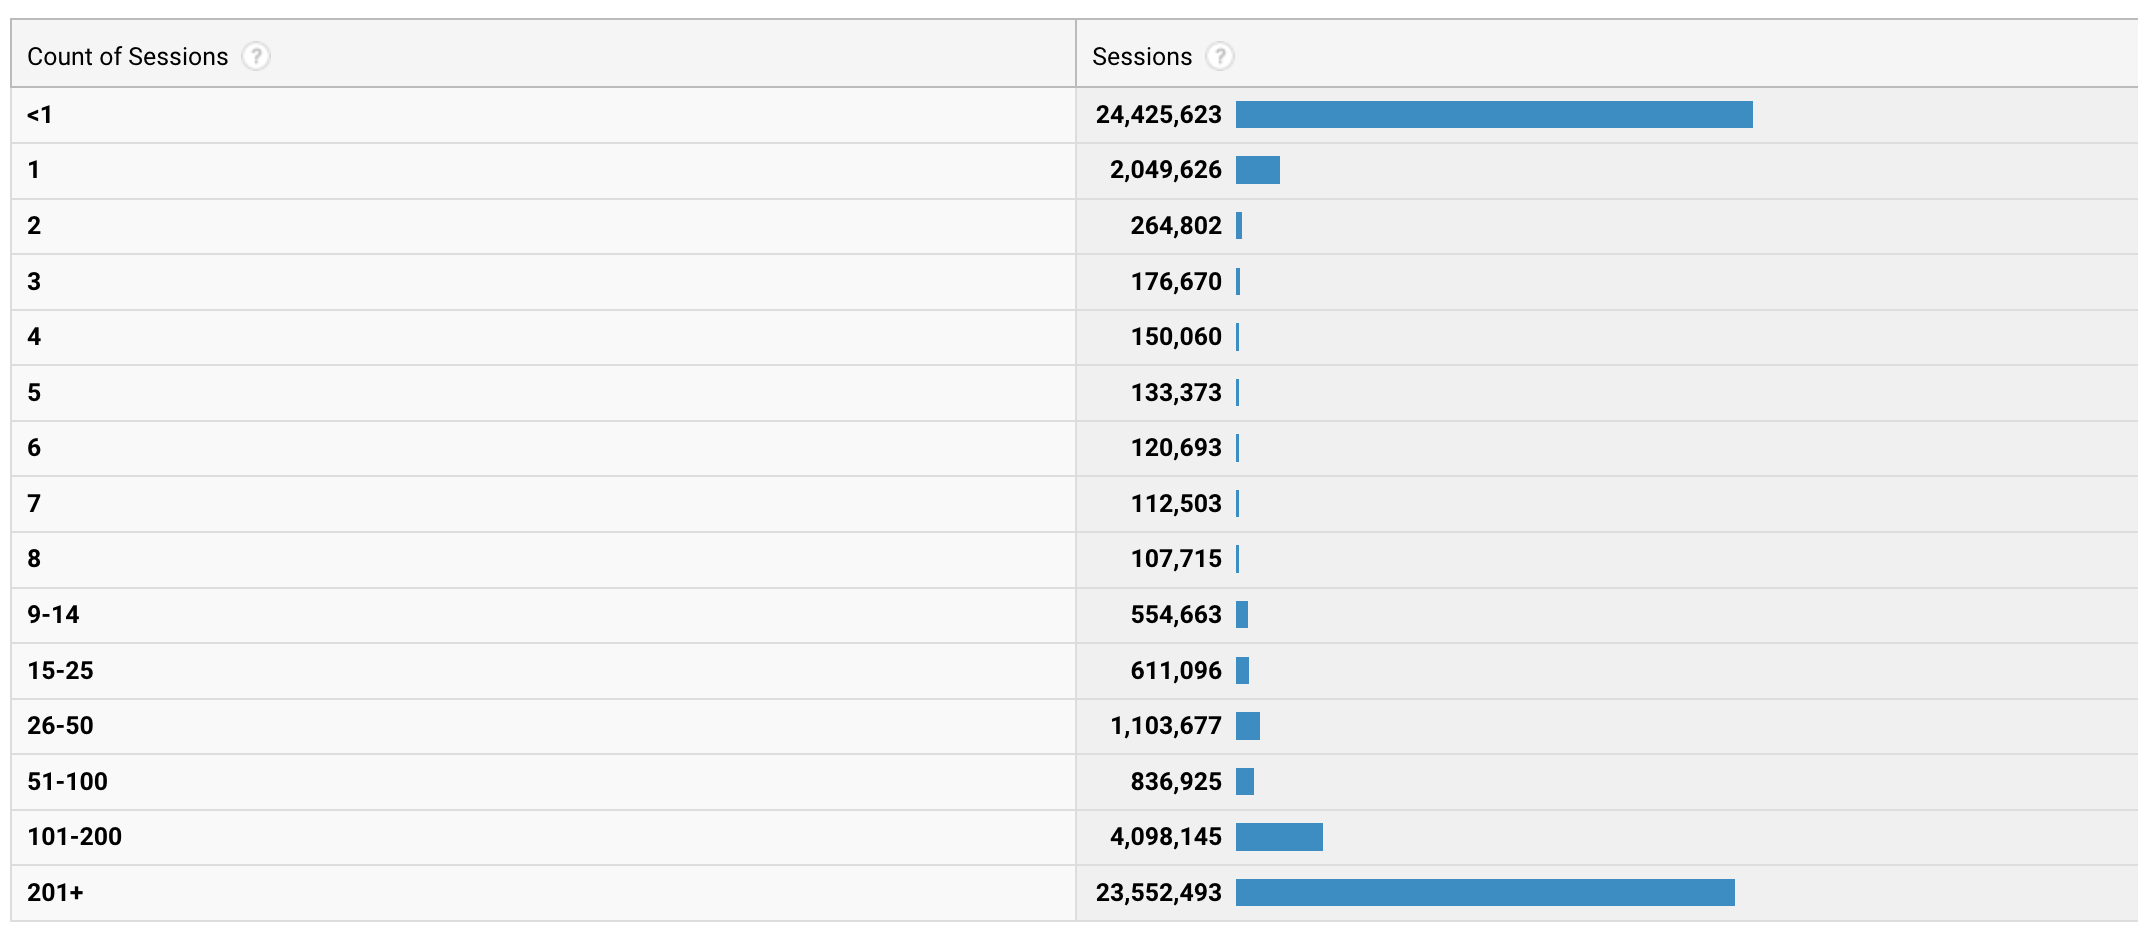
The first line is just sessions we've got no data on, so you can ignore that. As for the rest, you can see that the vast majority of sessions are generated by users who have done more than 200 sessions each. Unsurprisingly, large-scale long-term usage is what brings most of the sessions. This is in line with the fact that 96% of sessions last year were started by returning visitors.
Usage hours
An important change has happened over the last year in the way people use Report. In January 2022, we found that people mostly run their tests on weekdays. Now, the situation is reversed:
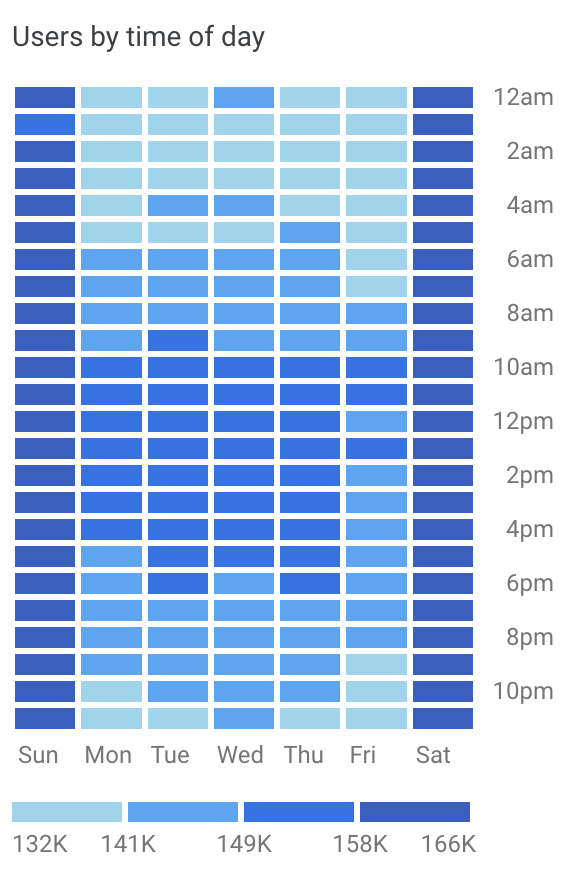
Most of the reports are generated on Saturdays and Sundays. Presumably, this means people are conducting automated runs during weekends that are then analyzed once work resumes on Monday. We're extremely happy to see this usage pattern - automation is always good news!
