Code coverage as a target
Calculating code coverage is a relatively simple way of checking how well your test suite is written. But how useful is this metric? Let's find out!
Code coverage as a target
Tracking code coverage has been very popular for a while, and it’s been fairly commonplace to shoot for 80% or even 100% code coverage. However, people have also been criticizing this metric a lot. So, let’s try to figure it out together! We'll see what decisions code coverage incentivizes if used as a target and what some alternatives to it might be.
Code coverage
When people say “code coverage,” they most often mean line coverage - the percentage of lines in your code that have been executed. This is a popular metric, and plenty of tools exist for calculating it. IntelliJ IDEA even has a bundled plugin for that. If you’re writing in Java, you could use JaCoCo; or if Python is your thing - go for Coverage dot py.
Here’s the problem with code coverage. A high percentage only tells us that things may or may not be alright. You’ve executed your code once, great. But considering the variability of inputs and all the possible integrations your code might have, this is a weak guarantee that your tests will find bugs present in the code.
The argument often follows that, yes, high coverage doesn’t mean things are good, but low coverage does tell us that things are bad. However, even that isn’t necessarily true.
The reason is that code coverage treats all code as uniform. If, for the sake of argument, your tests cover mostly getters and setters, 30% code coverage is pretty much the same as zero. On the other hand, if you are under time constraints and your tests cover essential code that could cause the most severe damage - 30% might actually be enough.
Of course, having enough tests to execute code at least once on demand is nice - it might prevent a few particularly embarrassing failures. But what do we get if we use code coverage as a target?
Because this metric is indiscriminate, it pushes us to write simplistic tests for everything - tests that might be superfluous in some cases and far too weak in others. And even simplistic tests might be very costly to set up, especially if we’re talking about UI tests.
Further, maintaining tests isn’t free - as your code changes, tests also have to change. So, you get a bloated test base that is expensive to run and maintain. This is a very real problem, and cutting down the number of tests requires you to prioritize - something that code coverage doesn’t allow you to do.
So, what alternatives do exist for code coverage?
Branch coverage
Branch coverage calculates the percentage of all possible conditional branches that your code has tested. It is also a popular metric today - IntelliJ IDEA, JaCoCo, and Coverage dot py can all measure branch coverage in addition to line coverage.
Branch coverage partially solves one of the problems mentioned with line coverage - it gives a stronger (although still not complete) guarantee that you’ve found all present bugs. But the main problem remains: branch coverage is just as indiscriminate toward code as line coverage.
Requirement coverage
If we want a deeper metric, we have to start from a completely different place: not the code but user needs.
Software is written based on requirements or user stories. These can be specified in, e.g., Jira and tracked in TestRail. Based on that, we can calculate the percentage covered by tests. We’ve already written about a case of using requirement coverage as a quality gate.
With requirement coverage, gathering data is somewhat trickier than with code coverage, but once you’ve hit your mark, you’ve got much more certainty that your tests provide value. More importantly, it pushes you toward testing things that make your code useful, not just lines of code.
Feature coverage
That is a somewhat higher-level version of requirement coverage (since features can combine several requirements). You can view feature coverage in Allure TestOps. In dashboards, there is an excellent widget called Tree Map:
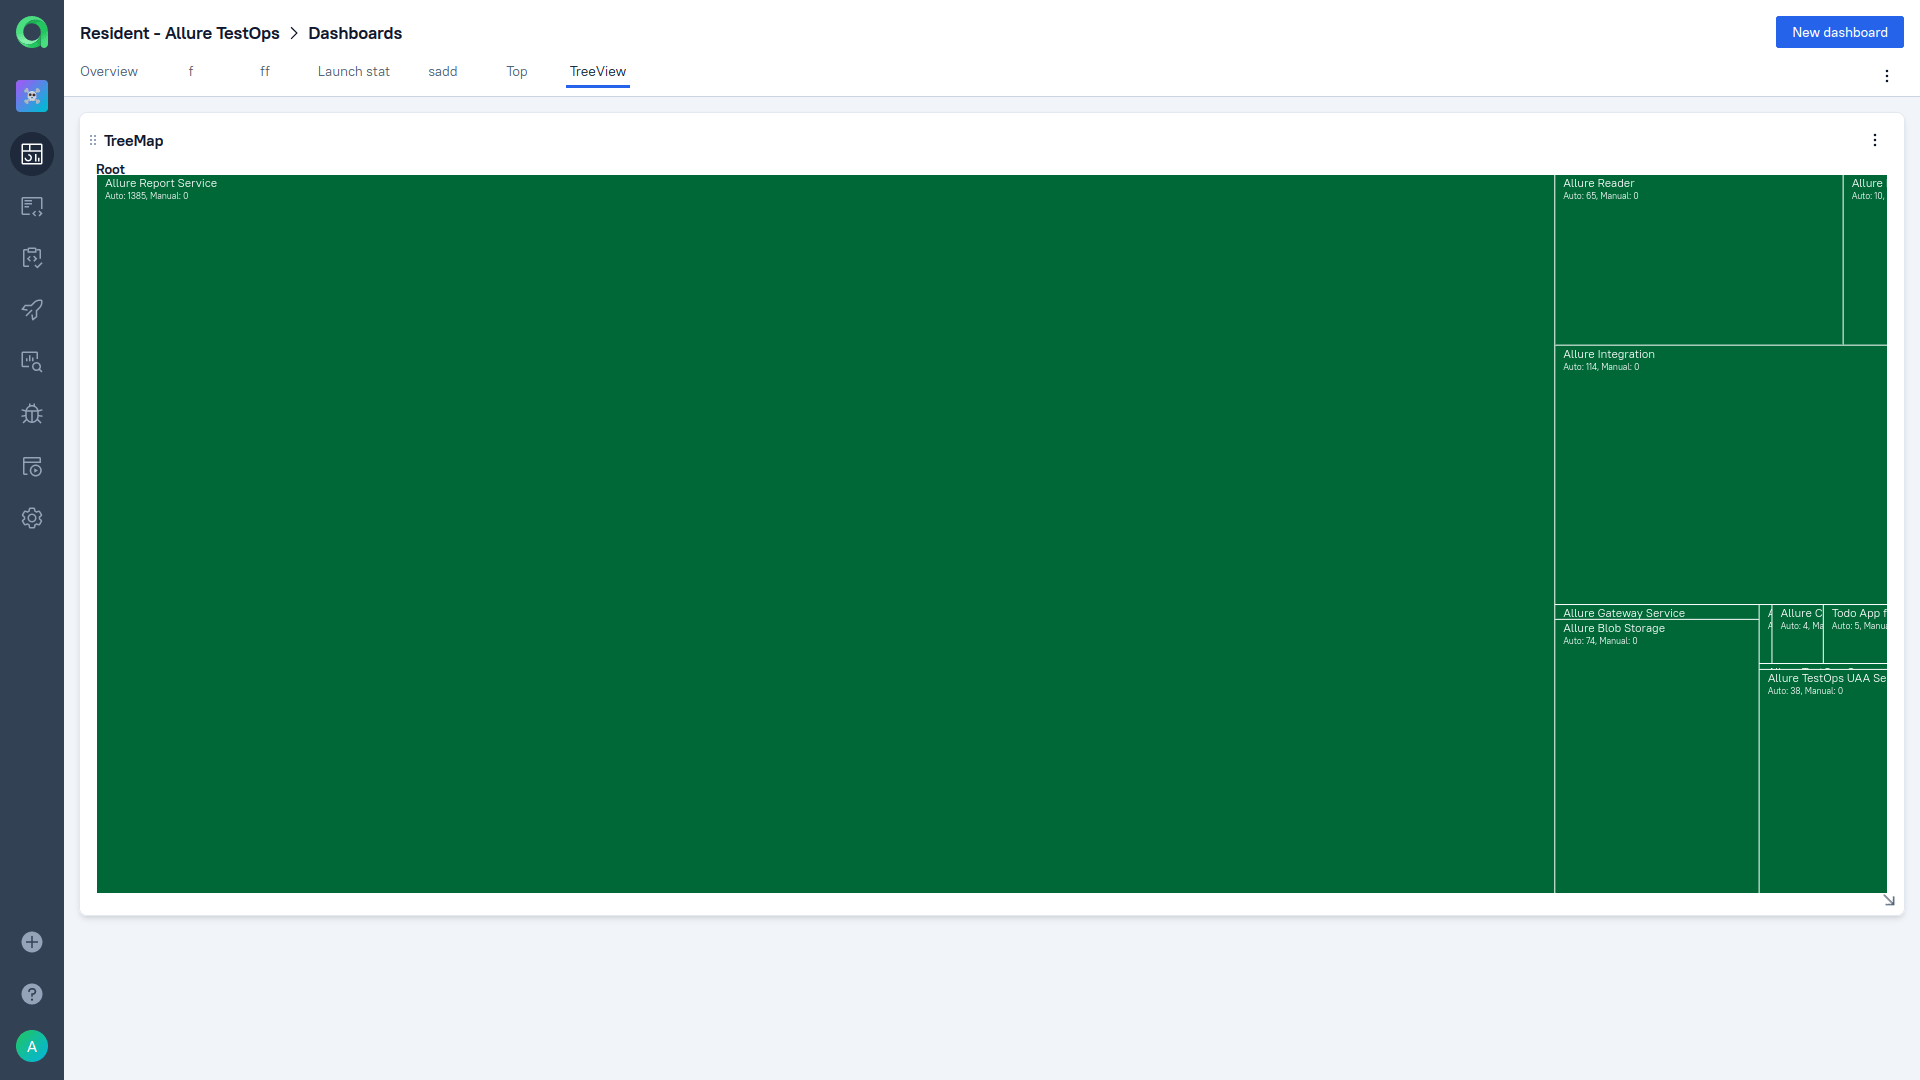
It is a great visualization of different types of coverage, including feature coverage. It doesn’t just show you what is covered and what isn’t; it shows how your tests are spread among epics, features, stories, or suites. It differentiates between automated tests and manual tests.
Also, each of the rectangles is interactive - if, for instance, you’re on "epic" level, you can click on one rectangle to drill down to the features inside that epic:
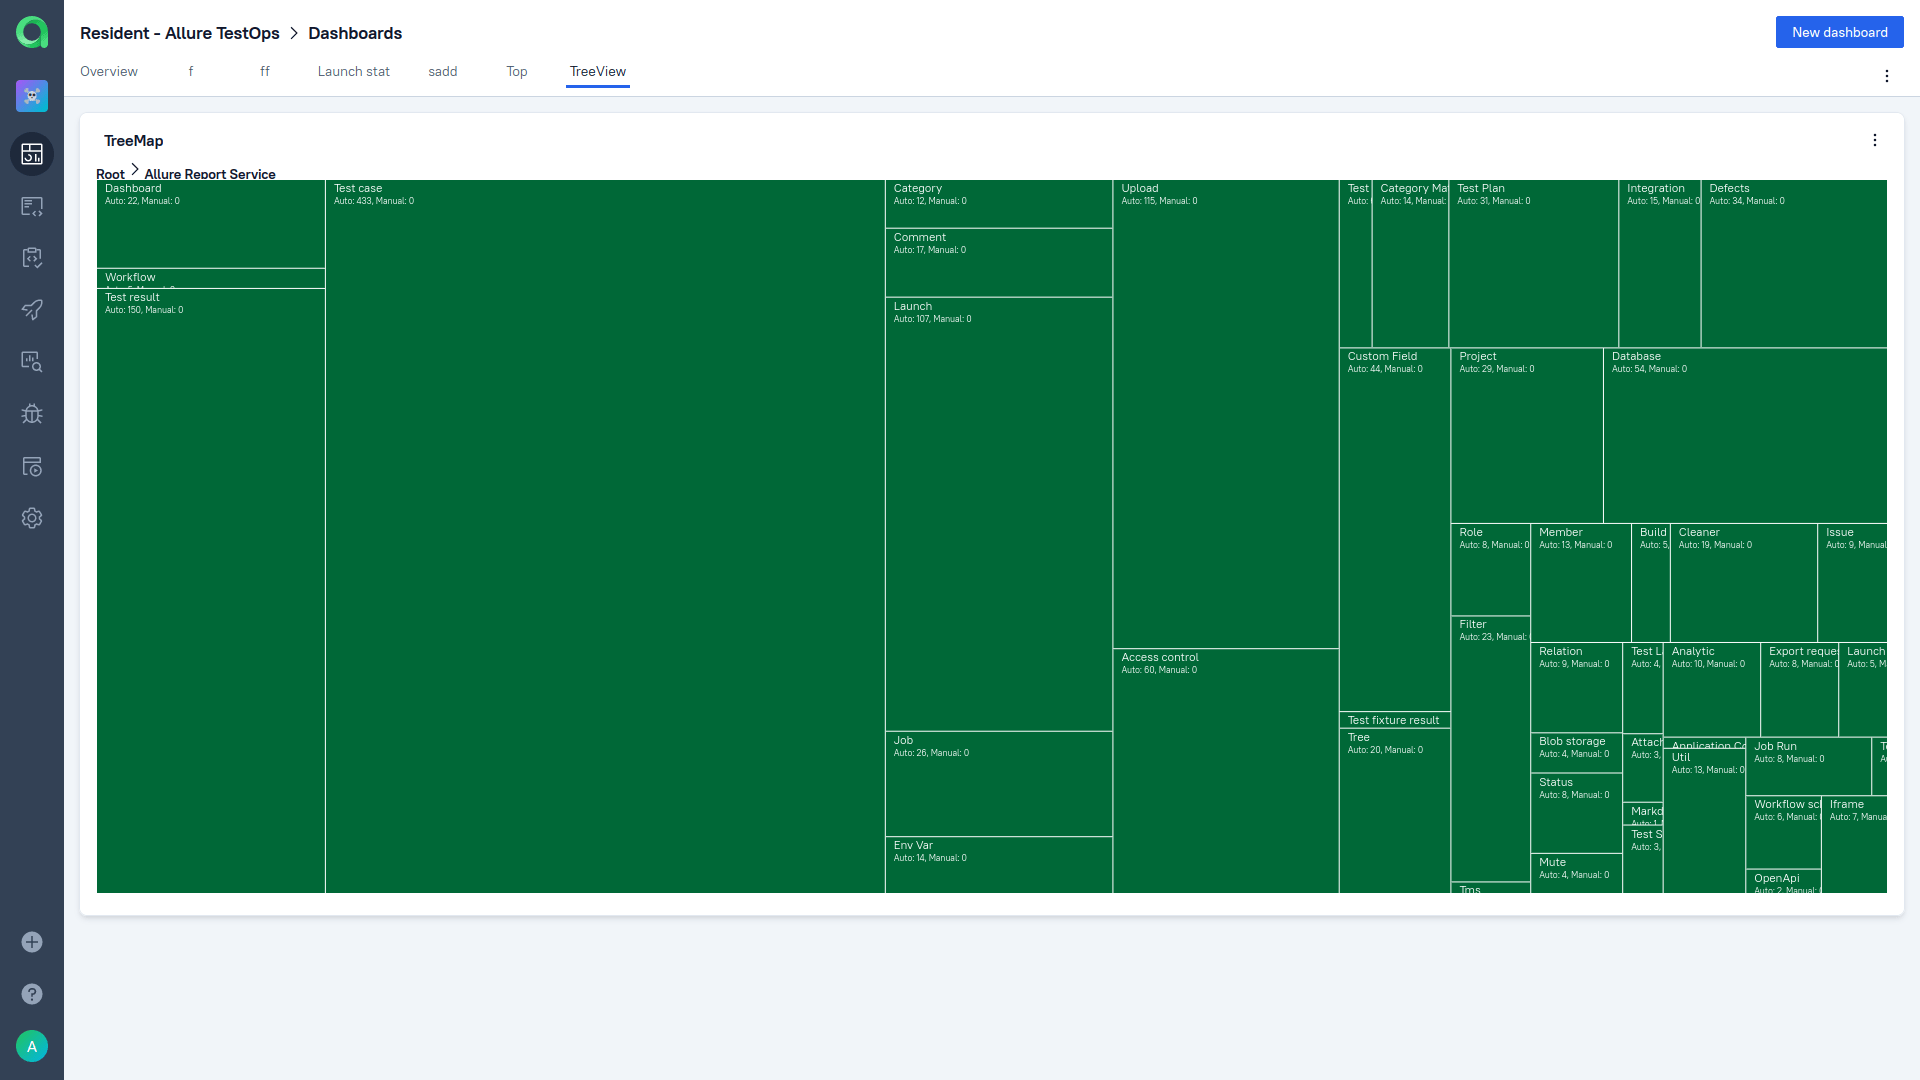
Here, you've got an excellent representation of how your testing efforts are distributed. This approach solves precisely the problem we’ve talked about before: you can prioritize areas of your product that are the most critical for the user.
Risk coverage
Not all requirements are equal, and time and hardware are always constrained. Some people advise you to take a step further: assign risks to each of your requirements or features and then calculate risk coverage. That will tell you how much you are testing things that affect users the most.
For a startup, this might be overcomplicating things. But once you’ve grown large enough and your product has accumulated enough features, risks are more or less the only thing you care about.
On the enterprise level, the stakes are much higher, and there are some features whose failure is disastrous. Other ones are secondary and might be used by just a few customers. Calculating and assigning risks adds another level of complexity for the metric, but it might be worth it at a certain stage.
Summary
Our main problem with code coverage is that it doesn’t tell you where to prioritize your testing effort. It just tells you to test everything once. We don’t believe that testing is its own reward; we root for an approach where the goal of QA is to maximize the value that we provide to users by testing. Requirement coverage, feature coverage, and (in a particular context) risk coverage help us do precisely that.